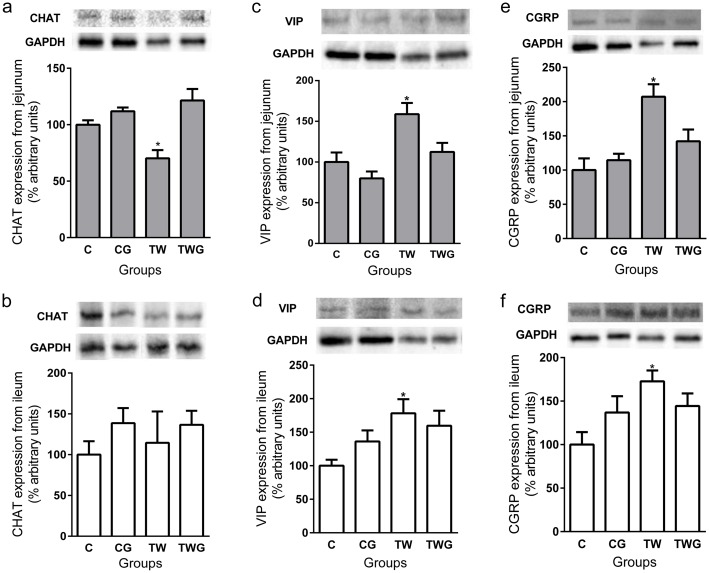
Fig 4. Effect of supplementation of L-glutamine and cachexia on proteins (CHAT, VIP and CGRP) expression from jejunal and ileal samples of each experimental group.
Groups: control (C); control supplemented with 2% L-glutamine (CG); Walker-256 tumor (TW); and Walker-256 tumor supplemented with 2% L-glutamine (TWG). (a) Jejunum CHAT expression and representative bands (on the top). (b) Ileum CHAT expression and representative bands (on the top). (c) Jejunum VIP expression and representative bands (on the top). (d) Ileum VIP expression and representative bands (on the top). (e) Jejunum CGRP expression and representative bands (on the top). (f) Ileum CGRP expression and representative bands (on the top). Bars represent means ± SEM of samples from four animals. The data are presented as percentage arbitrary units (% of control) after normalization (GAPDH). * indicates significant difference (p < 0.05) versus control group.

