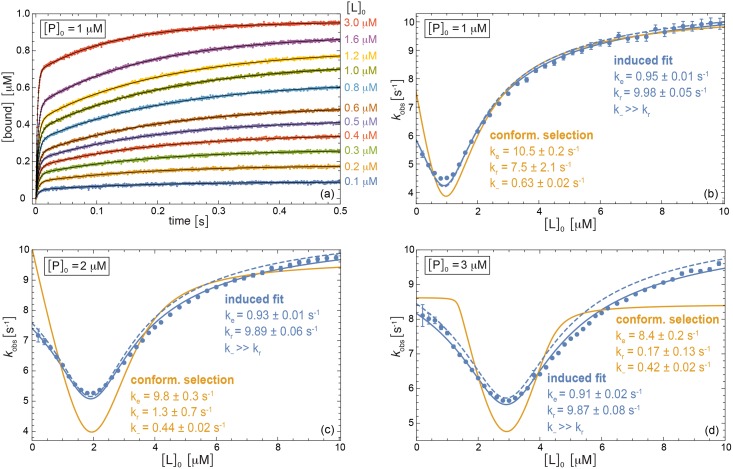
Fig 3. Numerical example for induced-fit binding with the rate constants k+ = 100 μM−1s−1, k− = 100 s−1, ke = 1 s−1, and kr = 10 s−1.
(a) Relaxation data for the bound complex obtained by numerical integration of the rate equations and subsequent addition of Gaussian noise with amplitude 0.004 μM at the total protein concentration [P]0 = 1 μM and exemplary total ligand concentrations [L]0. The black lines represent multi-exponential fits of the data points. (b) to (d) Comparison of kobs values obtained from multi-exponential fits of numerical relaxation data (points) to our theoretical results for kobs (lines) at the three different total protein concentrations [P]0 = 1 μM, 2 μM, and 3 μM and total ligand concentrations [L]0 between 0.1 μM and 10 μM. The full lines represent fits of Eq (1) for induced-fit binding (blue) and of Eq (6) for conformational-selection binding (orange), with fit parameter values specified in the figure. In these fits, the dissociation constant Kd = 1/11 μM is assumed to be known from equilibrium data. The dashed blue lines are obtained from Eq (1) for the ‘true’ rate constants of the numerical example.

