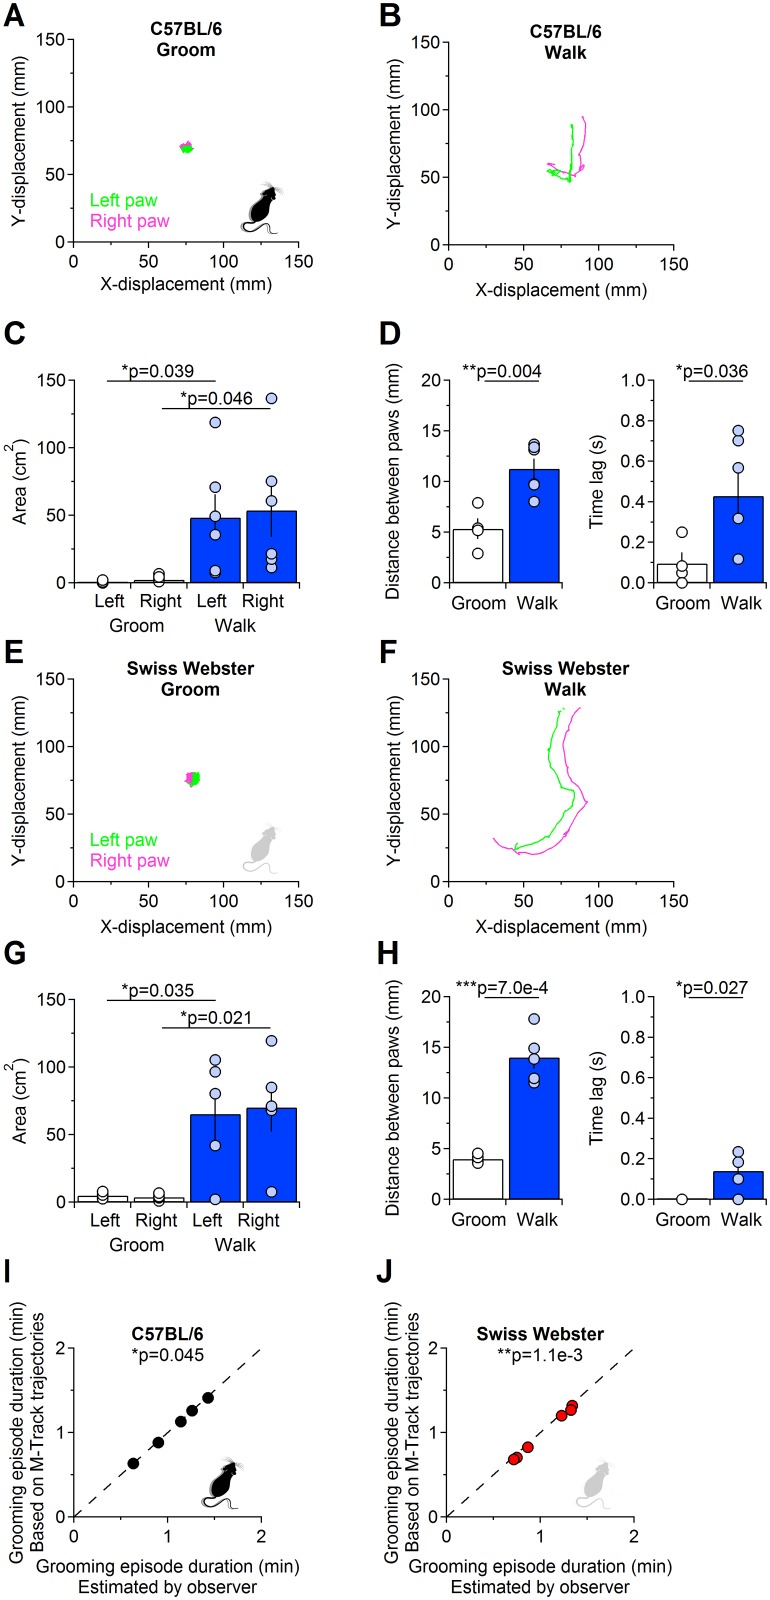
Fig 4. Example analysis of forepaw trajectories during grooming and walking.
(A) Example of left (Neon green) and right (Neon magenta) forepaw trajectories detected using M-Track during a grooming episode in a C57BL/6 mouse (black fur). (B) As in A, detected during a walking episode. (C) Estimated surface area covered by the forepaws during grooming (left: 0.74±0.47 cm2, right: 2.20±0.83 cm2 (n = 4)) and walking (left: 48±17 cm2, right: 54±20 cm2 (n = 5), *p = 0.039 and *p = 0.046, respectively). (D) Left: the distance between the left and right forepaws is significantly longer during walking than during grooming episodes (grooming: 5.3±1.0 mm (n = 4), walking: 11.3±1.0 mm (n = 5), **p = 0.004). Right: the time lag in the movement of the left and right forepaws during grooming (white bars and hollow dots) is significantly shorter than that measured during walking episodes (blue bars and light blue dots; grooming: 0.10±0.05 s (n = 4), walking: 0.43±0.11 s (n = 5), *p = 0.036). (E-H) As in A-D, for a Swiss Webster mouse (white fur). (I-J) Relationship between the duration of grooming episodes calculated based on M-Track trajectories and based on the measures obtained by visual inspection of videos by an observer. The measures of grooming episode duration obtained using M-track are slightly but consistently shorter than the ones obtained based on visual inspection of the videos, in C57BL/6 (I; (n = 5) *p = 0.045) and Swiss Webster mice (J; (n = 6) **p = 1.1e-3).

