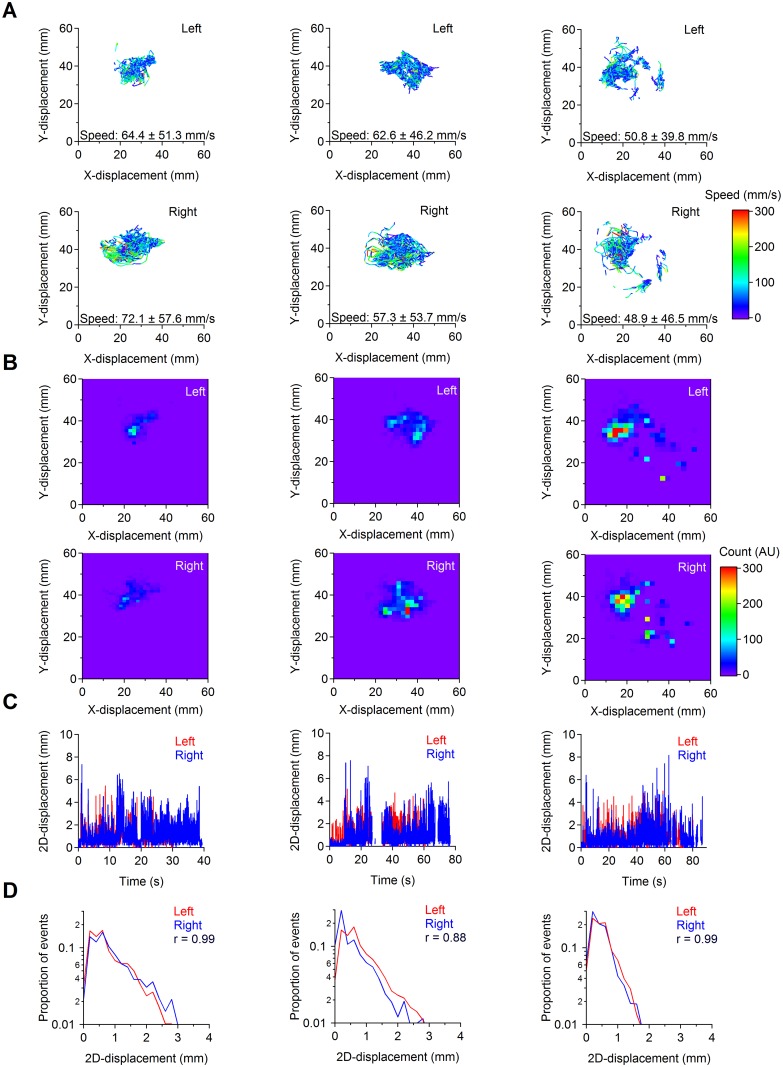
Fig 5. Example of forepaw trajectories during three consecutive grooming episodes.
(A) Example of forepaw trajectories detected for the left (top) and right forepaw (bottom) during individual grooming episodes, using M-Track. The color coding of each trajectory represents the speed with which the forepaw is moved. Although the area of the body groomed varies across episodes, the average grooming speed remains similar for the left and right forepaws across grooming episodes. The speed values represent mean ± S.D. (B) Image plots obtained from grooming trajectories for the left (top) and right (bottom) forepaws. The color of the image represents the number of times that the trajectory of the forepaw has moved over a given pixel. (C) x,y-displacements for each forepaw during individual grooming episodes. (D) Frequency count histogram of the frame-to-frame displacements for the left and right forepaws. We observed a high level of correlation for each one of the recorded grooming episodes (Pearson’s correlation coefficient: r = 0.95±0.03 (n = 3)).

