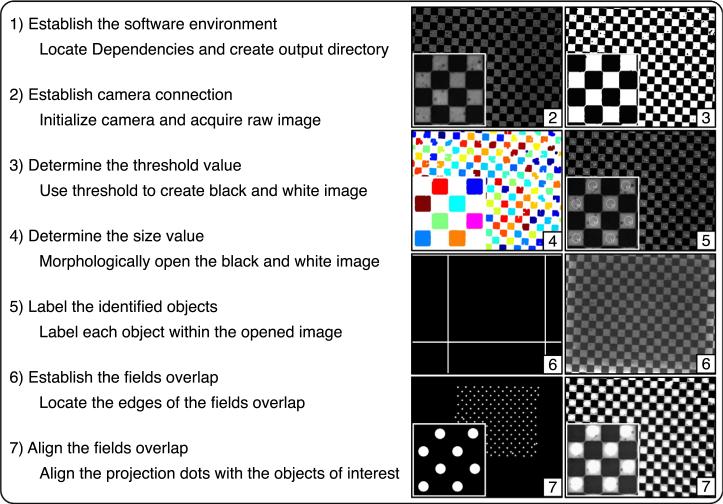
Fig. 10.
An illustration of the alignment procedure for the PIM. The seven steps on the left correspond to the seven steps in the supplemental software (Ref. 5) and demonstrated in the supplemental animation. The images at right are examples of the output using a checkerboard alignment grid (100-μm squares) with a zoomed-in region superimposed. Step one establishes the software environment on the computer independent of the PIM (no output). Step two establishes the connection with the camera and results in a raw image of the sample (raw image shown). Step three determines the threshold value to create a black-and-white image of the sample (black-and-white image shown). Step four determines the size value to morphologically open the black-and-white image and identify the objects of interest within the image (labelled image shown). Step five labels the objects of interest on the raw image for identification (tracked image shown). Step six establishes the overlap between the field of view and the field of projection (overlap within the field of projection shown on left and corresponding image from the field of view on the right). Step seven aligns the field of view with the field of projection (projection shown on left and corresponding image on the right).

