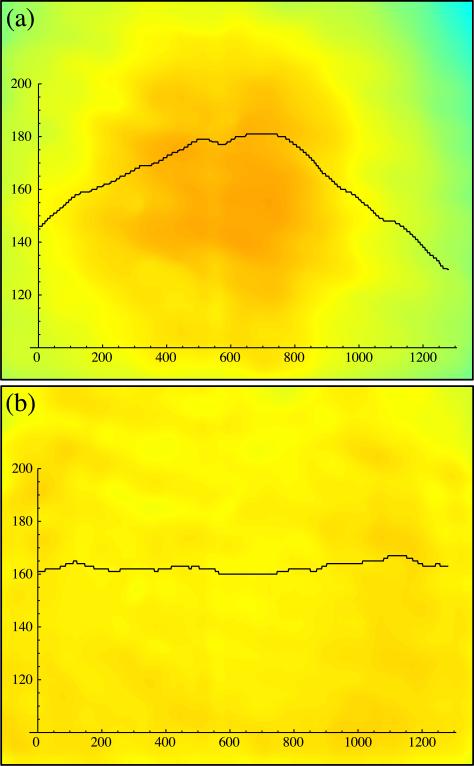
Fig. 5.
The illumination of the sample before and after software flattening. Shown are pseudocolor images of a clean sheet of glass with a representative intensity trace superimposed (pixel value vs pixel position). In both cases, the image was median filtered to remove noise. (a) An image where a spatially uniform illumination of RGB[0,0,125] is projected. Superimposed is a horizontal trace across the center of the field of view with a variation of 8.6%. (b) An image where the illumination has been flattened using the formula in the text with f = 0.25 and n = 0.95. Superimposed is a horizontal trace across the center of the field of view with a variation of 1.1%. The corrected and uncorrected illuminations are both scaled to align with the field of view. Regions of the field of projection outside the field of view were not illuminated.

