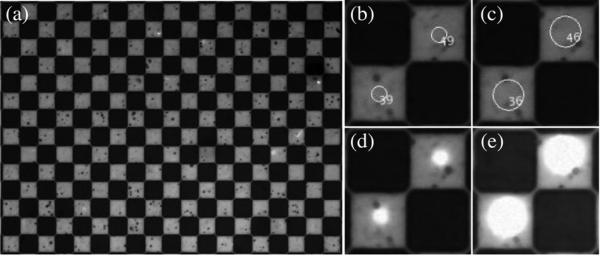
Fig. 6.
Examples of images saved during each iteration of the control software. (a) The raw image collected imaging the checkerboard alignment grid at ×4 magnification. The squares are 100 μm per side. (b)–(c) Labels and opening shapes superimposed over a small region of the raw image: (b) disk with an 8-pixel radius; (c) disk with a 16-pixel radius. (d)–(e) A small region of the image taken while projecting a dot matching the opening object: (d) disk with an 8-pixel radius; (e) disk with a 16-pixel radius.

