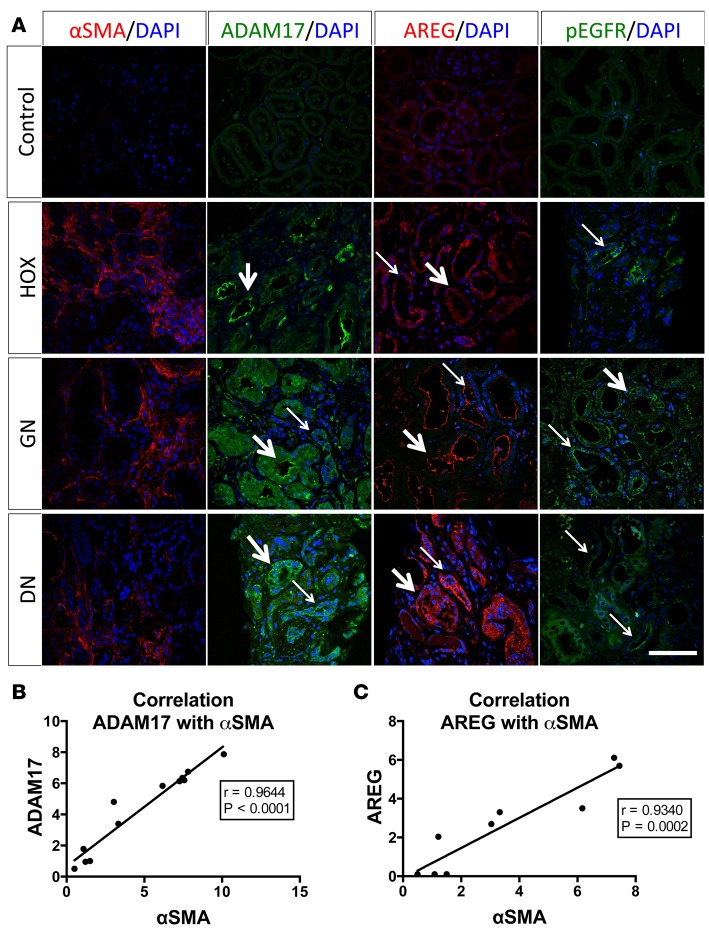
Figure 7. Induction of ADAM17 and AREG protein expression and EGFR phosphorylation in human kidney disease.
(A) The presence of the fibrotic marker αSMA and of ADAM17, AREG, and phospho-EGFR were examined in human kidney biopsies by immunostaining. Representative images of hyperoxaluria (HOX; intrarenal tubular obstruction by crystals not shown in image), glomerulonephritis (GN), and diabetic nephropathy (DN) cases are shown (4 controls, 4 HOX, 4 GN, and 4 diabetic patients were examined; representative images are shown) (thick arrows: positive staining in proximal tubular-like structures; thin arrows: positive staining in distal tubular-like structures; scale bar: 50 μm). (B and C) Correlation of ADAM17 (B) or AREG (C) protein expression levels with αSMA levels across all patients studied (n = 9–12). The Pearson correlation coefficient (R) and P value are provided in each graph. ADAM17; a disintegrin and metalloprotease 17; AREG, amphiregulin; EGFR, epidermal growth factor receptor; αSMA, alpha smooth muscle actin.

