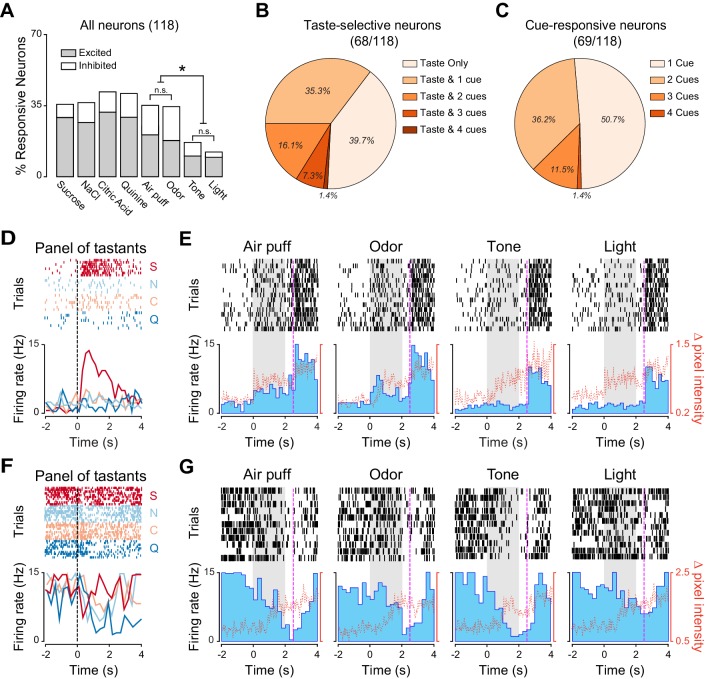
Figure 3. Neural representation of different sensory modalities after cue-taste association.
(A) Percentage of neurons (n = 118) modulated (excited [gray] or inhibited [white]) by each tastants and anticipatory cues. Asterisks indicate post-hoc test corrected for multiple comparisons (Marascuillo’s test, p<0.05). (B) Pie chart showing the proportion of taste selective neuron (n = 68) that are modulated exclusively by taste (Taste only) or by taste and one (Taste & 1), two (Taste & 2), three (Taste & 3) or four (Taste & 4) anticipatory cues. (C) Pie chart showing the proportion of cue responsive neuron (n = 69), which are only modulated by one (1 Cue), two (2 Cues), three (3 Cues) or all anticipatory cues (4 Cues). (D) Raster plot and PSTH of a representative GC neuron showing a significant excitatory response to sucrose. (E) Raster plot and PSTH of a GC neuron (same as the one showed in panel D) featuring significant excitatory responses to Air puff and Odor and no responses to Tone and Light. (F) Raster plot and PSTH of a GC neuron showing inhibitory responses to multiple tastants. (G) Raster plot and PSTH of a GC neuron (same as the one showed in panel F) displaying significant inhibitory responses to multiple cues (air puff, odor, tone and light). For D and F: vertical lines at time 0 indicate the onset of the taste delivery. S for sucrose, N for NaCl, C for citric acid and Q for quinine. For E and G: gray rectangular areas indicate the period of cue presentation. Vertical dotted lines at time 2.5 indicate the onset of sucrose delivery. Red dotted line represents the time-course of orofacial movement activity.
DOI: http://dx.doi.org/10.7554/eLife.16420.009


