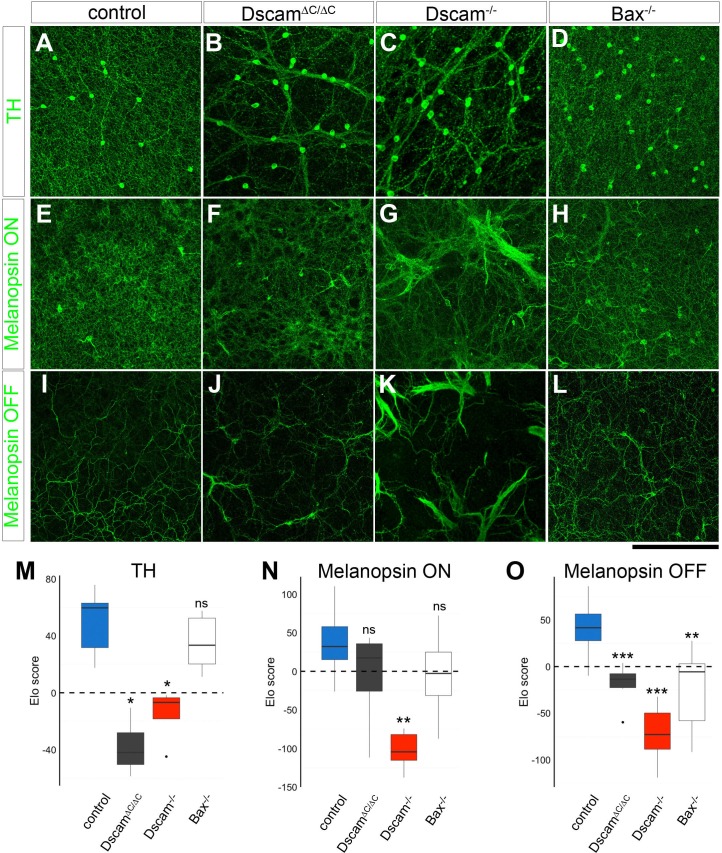
Figure 6. Neurite fasciculation is separable from density-dependent cell body clustering.
(A) DA cell neurites evenly fill their receptive fields in control mice, but form fascicles in Dscam∆C/∆C(B) and Dscam-/- (C) animals. (D) DA fascicles are rarely observed in Bax-/- mutants. (E) M2 ipRGC dendrites imaged in the ON region of the IPL are evenly distributed in wild type mice and largely remain so in Dscam∆C/∆C(F) and Bax-/- (H) mutants, while severe fasciculation is evident in Dscam-/- retinas (G). I) In the OFF strata of the IPL, M1 ipRGC dendrites are diffusely organized. There is modest fasciculation in Dscam∆C/∆C(J) and Bax-/- (L) mice, while fasciculation in Dscam-/- retinas (K) is much more severe. (M–O) Elo ranking of fasciculation severity between genotypes demonstrates that DA neurites (M) are clearly fasciculated in Dscam∆C/∆Cand Dscam-/- retinas, but not in Bax-/-, which had loss of mosaic cell body spacing. Conversely, ipRGCs in Dscam∆C/∆Cdid not have significantly more fasciculation than Bax-/-either in the ON (N) or OFF (O) layers, despite having a more severe cell body clustering. Box plots represent the median, first and third quartile, range, and outliers. *p<0.05; **p<0.01; ***p<0.001; n.s. is not significant by Wilcoxon rank sum test. Scale bar is 250 µm. See also Figure 6—figure supplement 1.


