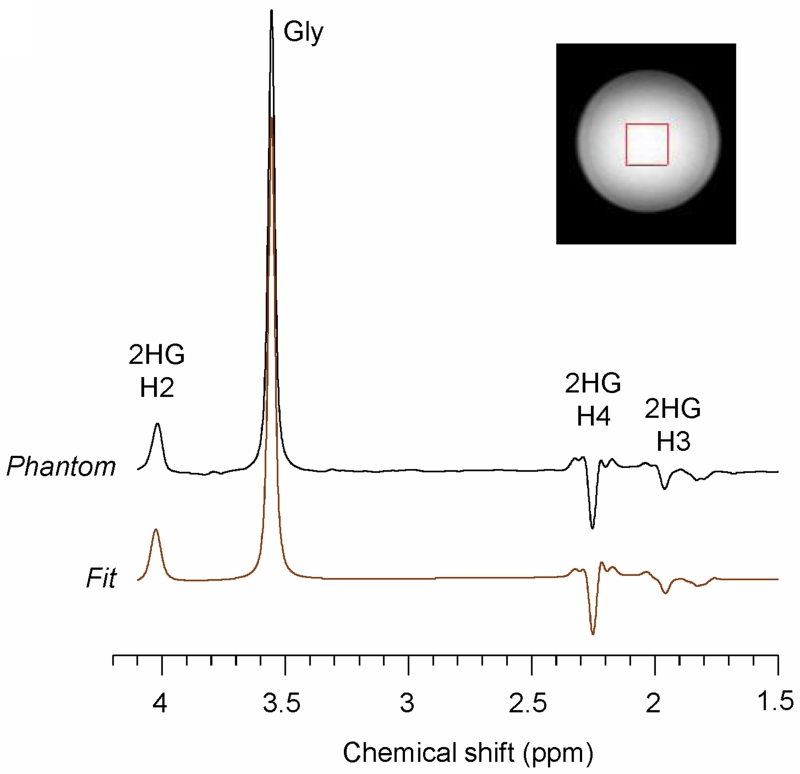
Figure 2.
An in vitro spectrum from 2HG (12 mM) and glycine (20 mM), obtained with PRESS at TE = 78 ms (TE1 = 58 ms, TE2 = 20), is shown together with an LCModel fit. Data were obtained from a 20 × 20 × 20 mm3 voxel, with TR = 9 s and NSA = 64. The spectrum was broadened to glycine linewidth of 9 Hz prior to the spectral fitting. A vertical dotted line is drawn at 2.25 ppm.

