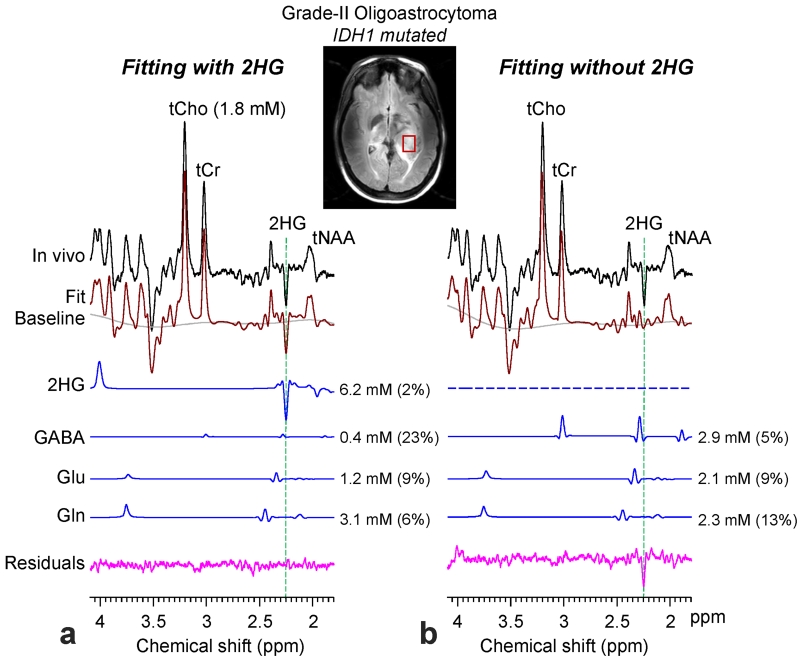
Figure 4.
An in-vivo spectrum from an IDH1 mutated grade-II oligoastrocytoma is shown together with LCModel fits, baseline and residuals from fitting with 2HG (left) or without 2HG (right) in the basis set. The signals of 2HG, GABA, Glu and Gln are shown with the estimated concentrations and CRLBs in parenthesis. The voxel size was 2.0 × 1.5 × 1.5 cm3 (TR = 2.5 s, NSA = 128). Vertical dashed lines are drawn at 2.25 ppm to indicate the location of the 2HG C4-proton resonance.

