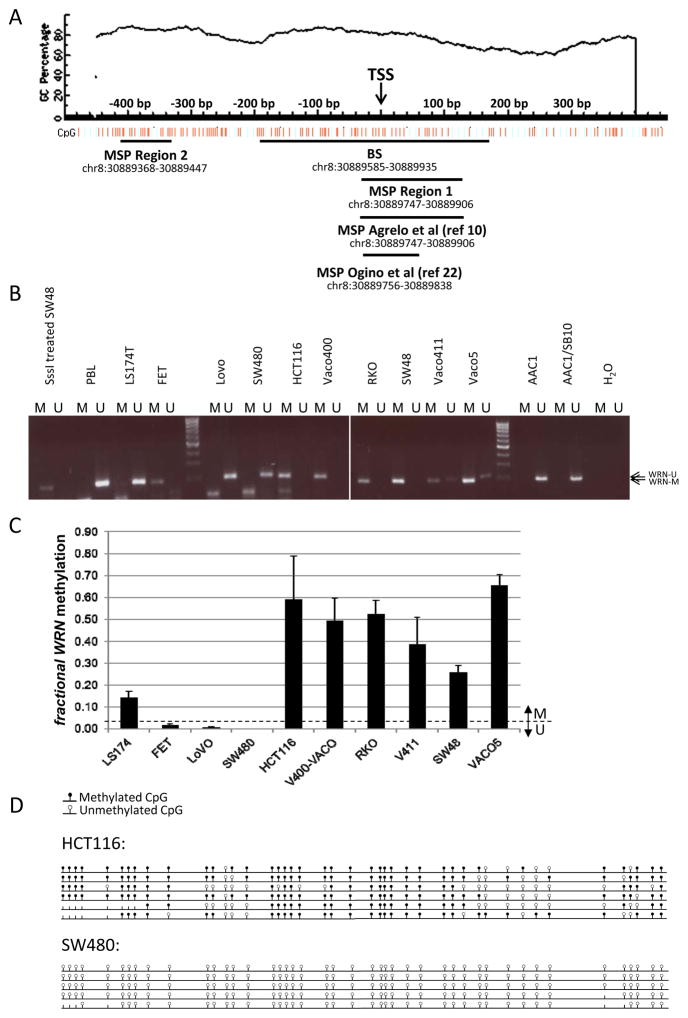
Figure 1. WRN promoter region methylation analysis in cell lines.
A. WRN promoter region CpG island and primer locations Genomic coordinates, CpG density and positions are shown in the top panel. Each vertical bar in the lower panel represents the presence of a CpG dinucleotide. Black horizontal bars indicate regions amplified by newly designed and validated MSP primer pairs (Region 1 and Region 2), the region amplified by the original primer pair described by Agrelo et al (10), and the region targeted for bisulfite sequencing (BS). TSS, Transcription Start Site. This figure was created using MethPrimer (39). B. Methylation analysis of Region 1 (see Figure 1) in the adenoma cell line AAC1 and in colon cancer cell lines. DNA from Peripheral Blood Lymphocytes (PBL) was used as an unmethylated control. H2O and DNA from SssI methylase-treated DNA from the colorectal cancer cell line SW48 were used, respectively, as ‘no template’ and ‘methylated template’ controls. C. Quantitative methylation analysis of WRN promoter Region 2 in the same colon cancer cell lines shown in panel A. D. Sodium bisulfite sequencing results of WRN gene promoter on cell lines HCT116 and SW480 in the region depicted in Figure 1. Each row represents an individual cloned allele and each circle indicates a CpG dinucleotide. Black circle=methylated CpG site; white circle=unmethylated CpG site; no circle=not determined.

