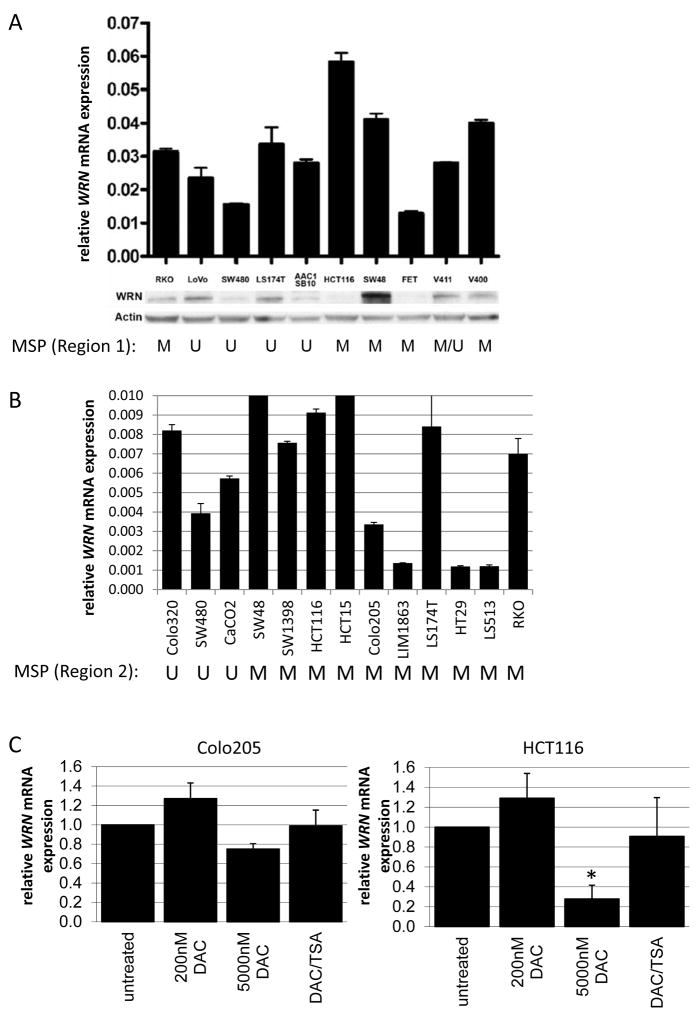
Figure 2. WRN expression analysis in cell lines.
A. WRN mRNA (upper panel) and protein (lower paired panels) expression in CRC cell lines in relation to methylation status in WRN promoter Region 1 (lower panel). Error bars represent standard deviations across triplicate independent experiments, in which WRN mRNA was normalized to mRNA expression of the reference gene GUSB (upper panel) and, for protein expression β-actin (lower panel). Methylation status of WRN promoter Region 1 is indicated below each pair of immunoblots (M = methylated; U = unmethylated). B. WRN mRNA expression level in relation to methylation status of WRN promoter Region 2.Error bars represent standard deviations of mean expression values of two independent experiments. Methylation status of WRN promoter Region 2 is indicated below each cell line designation (M = methylated; U = unmethylated). C. WRN mRNA expression analysis of Colo205 (left) and HCT116 (right) with and without 5-aza-2-deoxycytidine (DAC) or DAC/trichostatin A (TSA) treatment. Bars represent mean in two independent experiments, with error bars represent standard deviations. Expression was quantified relative to mRNA expression levels of B2M. *p=0.001

