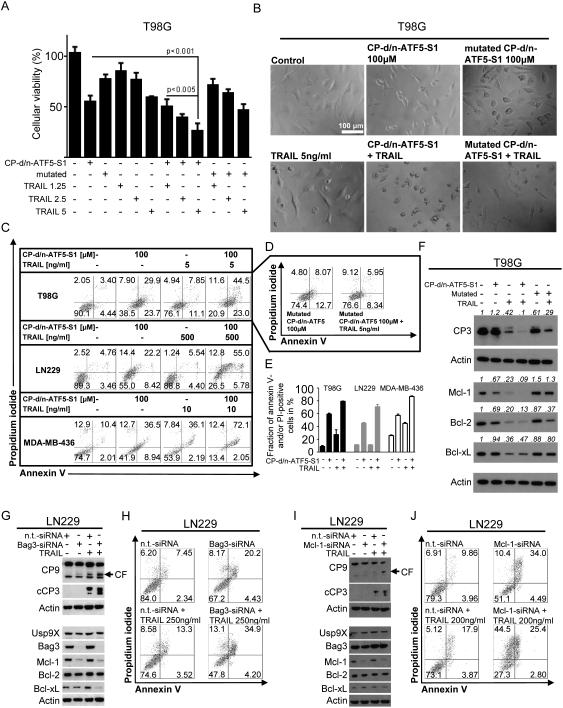
Figure 5.
A, T98G glioblastoma cells were treated with CP-d/n-ATF5-S1 (50 μM), mutated CP-d/n-ATF5-S1 (50 μM) and increasing concentrations of TRAIL as indicated. After 72h MTT assays were performed. Columns: means. Error bars: standard deviation (SD). B, representative microphotographs at 40x magnification of T98G glioblastoma cells treated with CP-d/n-ATF5-S1, TRAIL, the combination of both or solvent for 48h. In addition, microphotographs of cells treated with mutated CP-d/n-ATF5-S1 (100 μM) alone or combined with TRAIL (5 ng/ml) are shown. C, Representative flow plots of T98G, LN229 glioblastoma and MDA-MB-436 breast cancer cells treated for 72h with CP-d/n-ATF5-S1, TRAIL, the combination of both or solvent at the indicated concentrations prior to staining with annexin V/propidium iodide and flowcytometric analysis. D, Representative flow plots of T98G glioblastoma cells subjected to treatment with mutated CP-d/n-ATF5-S1 alone or in combination with TRAIL prior to staining for annexin V/PI and flowcytometric analysis. E, quantitative representation of the fraction of annexin V and/or PI-positive cells for T98G, LN229 and MDA-MB-436 cells that were treated as in C. Columns, means of three serial measurements. Bars, SD. F, T98G glioblastoma cells were treated with CP-d/n-ATF5-S1 (100 μM), mutated CP-d/n-ATF5-S1 (100 μM) and TRAIL (5 ng/ml) at indicated combinations for 24h under reduced serum conditions. Whole-cell extracts were examined by Western blot for caspase-3 (CP3), Mcl-1, Bcl-2 and Bcl-xL. Actin Western blot analysis was performed to confirm equal protein loading. Densitometric analysis was performed using ImageJ (National Institutes of Health, U.S.A., http://imagej.nih.gov/ij). Data were normalized first to the respective actin control and second to the respective treatment control. G, LN229 glioblastoma cells were treated with non-targeting (n.t.)-siRNA, Bag3-siRNA and TRAIL as indicated. Whole-cell extracts were examined by Western blot for caspase-9 (CP9, CF=cleaved fragment), cleaved caspase-3 (cCP3), Usp9X, Bag3, Mcl-1, Bcl-2 and Bcl-xL. Actin served as loading control. H, Representative flow plots of LN229 glioblastoma cells treated with non-targeting (n.t.)-siRNA or Bag3-siRNA prior to additional treatment with TRAIL or solvent for 24h and staining with annexin V/propidium iodide plus flowcytometric analysis. I, LN229 glioblastoma cells were treated with non-targeting (n.t.)-siRNA, Mcl-1-siRNA and TRAIL as indicated. Whole-cell extracts were examined by Western blot for caspase-9 (CP9, CF=cleaved fragment), cleaved caspase-3 (cCP3), Usp9X, Bag3, Mcl-1, Bcl-2 and Bcl-xL. Actin served as loading control. J, Representative flow plots of LN229 glioblastoma cells treated with non-targeting (n.t.)-siRNA or Mcl-1-siRNA prior to additional treatment with TRAIL or solvent for 24h and staining with annexin V/propidium iodide plus flowcytometric analysis.

