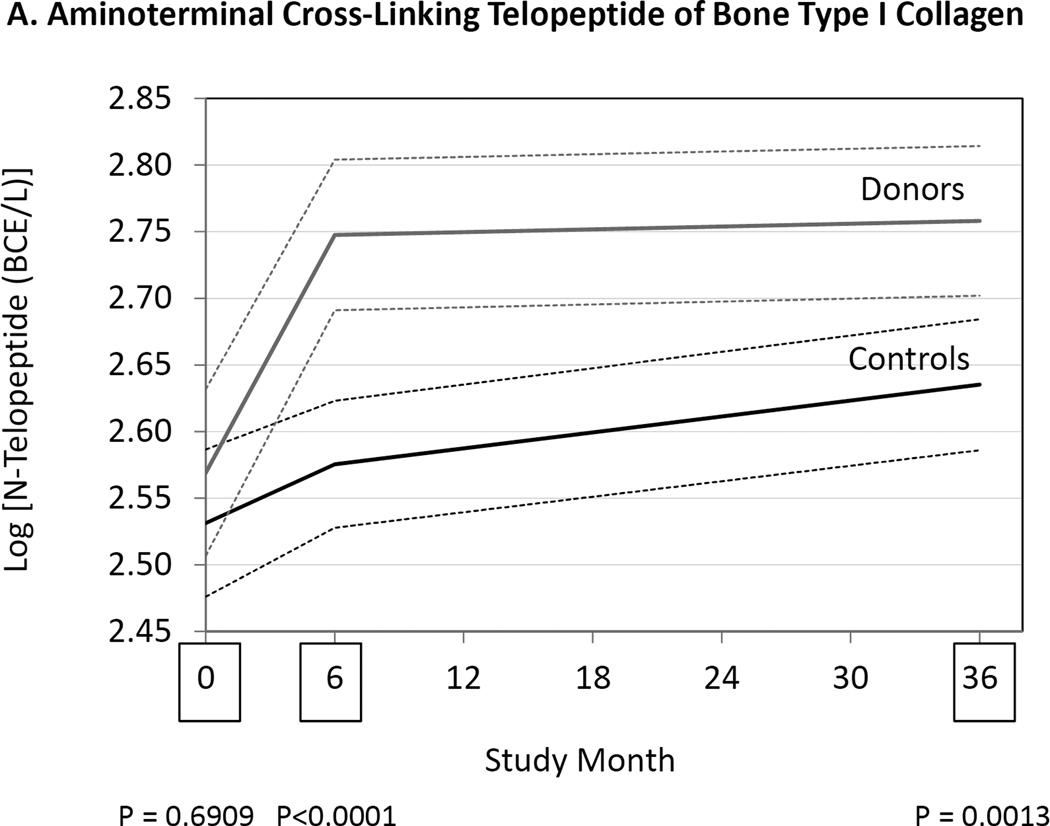
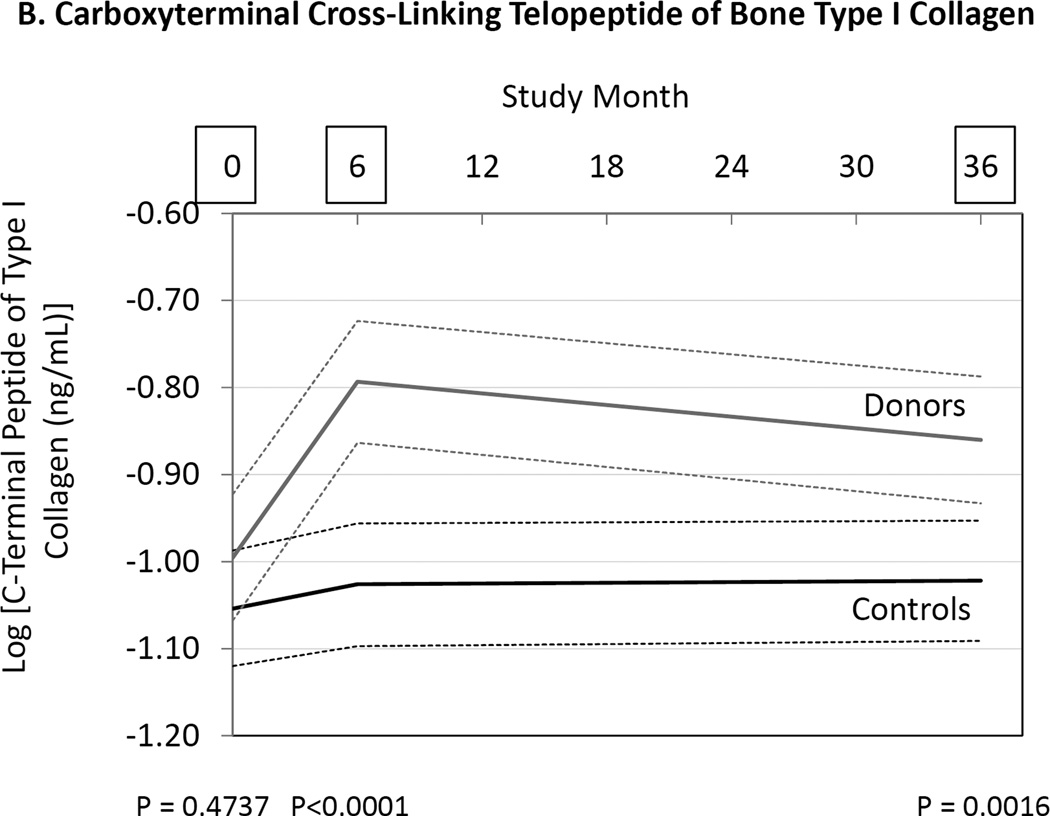
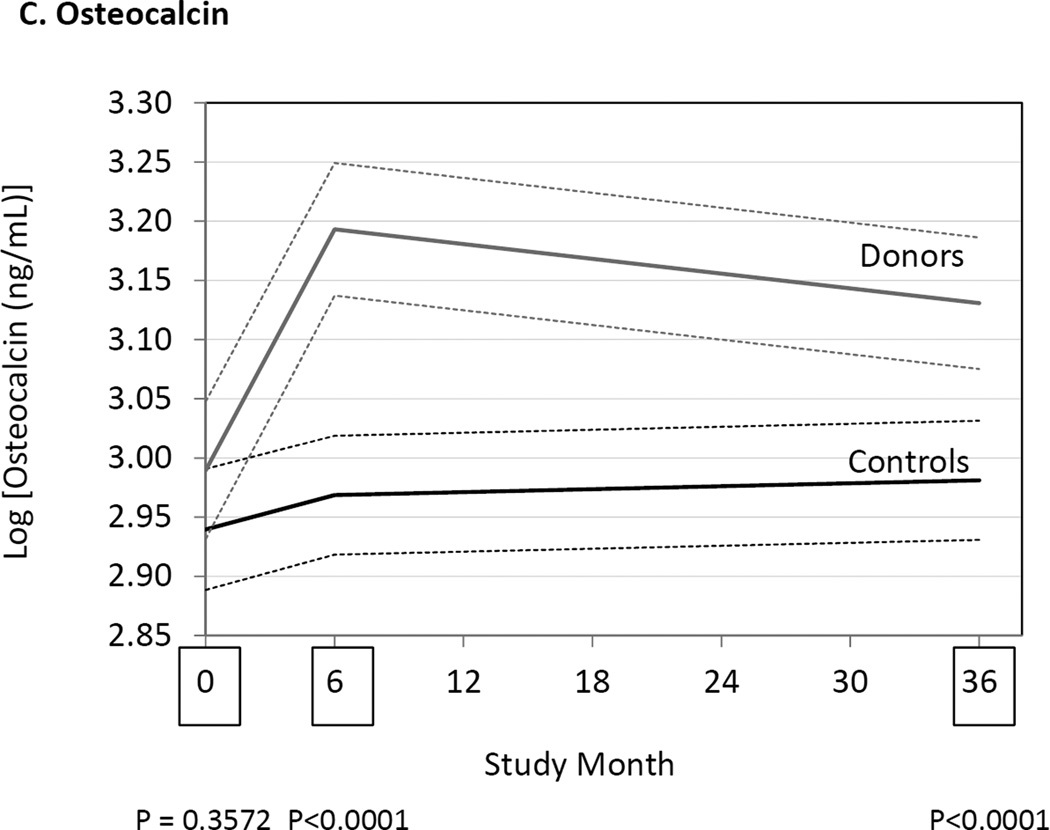
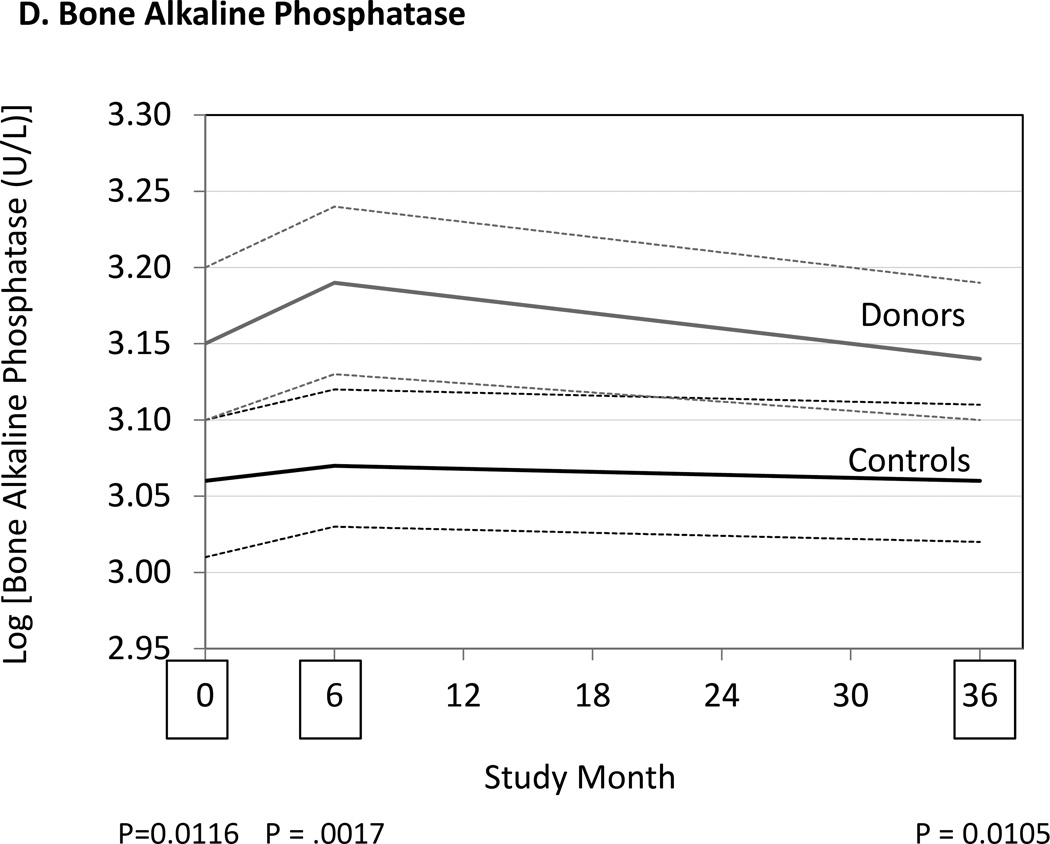
Figure 2.
Differences between donors and controls, before and after donation, in concentrations of serum aminoterminal cross-linking telopeptide of bone collagen (Panel A), carboxyterminal cross-linking telopetide of bone collagen (Panel B), osteocalcin (Panel C), and bone alkaline phosphatase (Panel D). Gray solid lines are means and gray dashed lines are 95% confidence intervals for controls. Black solid lines are means and black dashed lines are 95% confidence intervals for controls. P-values compare donors with controls. The times of study visits are indicated on the x-axis by squares. The numbers of samples assayed and the values at each time point are indicated in Table 3.


