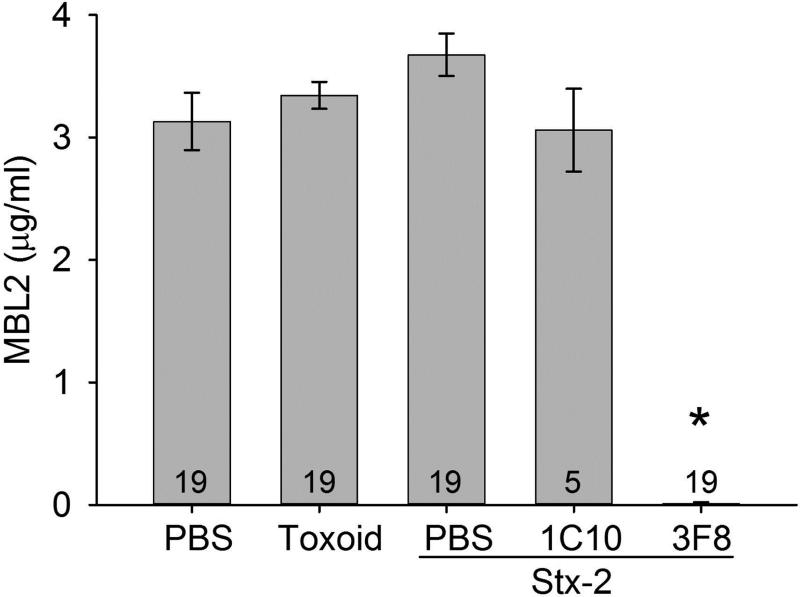
Figure 2. Serum MBL2 concentrations in MBL2 KI mice on Day 4.
MBL2 concentrations remained at baseline levels after four Days in all groups, except those treated with anti-MBL2 mAb, 3F8, which completely inhibited circulating MBL2 levels. Data are shown as mean ± SEM. Numbers within the bars represent the number of animals studied. *p<0.001 comparing 3F8 + Stx-2 group to all other groups

