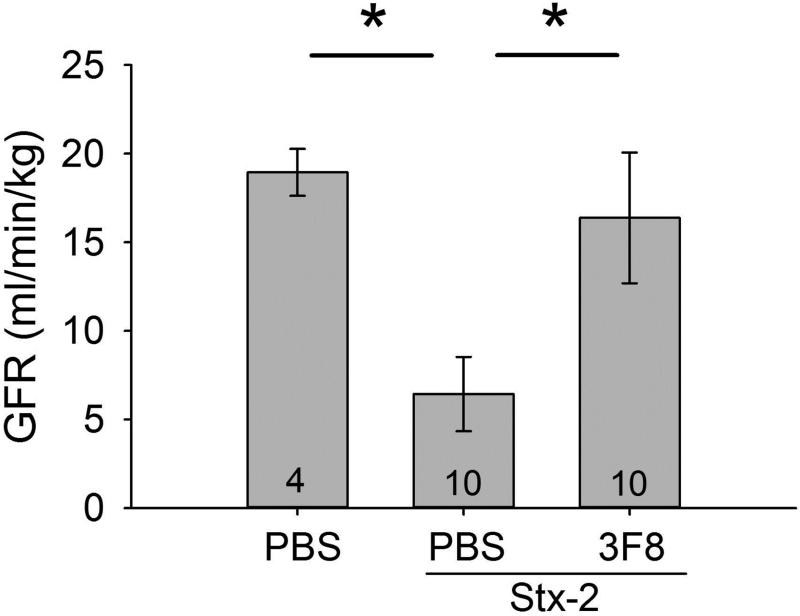
Figure 6. Assessment of renal function in STEC HUS model with and without 3F8.
Glomerular filtration rate (GFR) was determined as serum inulin clearance. GFR was significantly decreased in the PBS + Stx-2 group compared to the PBS only group and also to the 3F8 treated group. Bars and brackets represent mean ± SEM and numbers in the bars represent number of mice studied. *p<0.05

