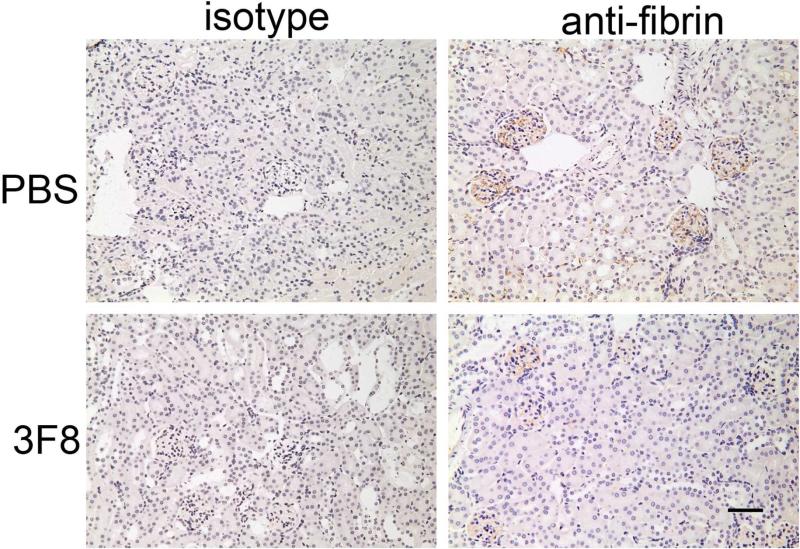
Figure 8. Immunohistochemical analysis of renal fibrin deposition.
Representative kidney sections stained for fibrin or porcine C5a (isotype control) are shown in Panel A. No obvious thrombi were observed in the glomeruli. Fibrin deposition was clearly observed in glomeruli. Quantitative area of fibrin deposition (Panel B; described in Methods) in the glomeruli are shown as bars and brackets representing mean ± SEM. Numbers in the bars represent number of mice studied. ***p<0.001. Scale bar = 50μm

