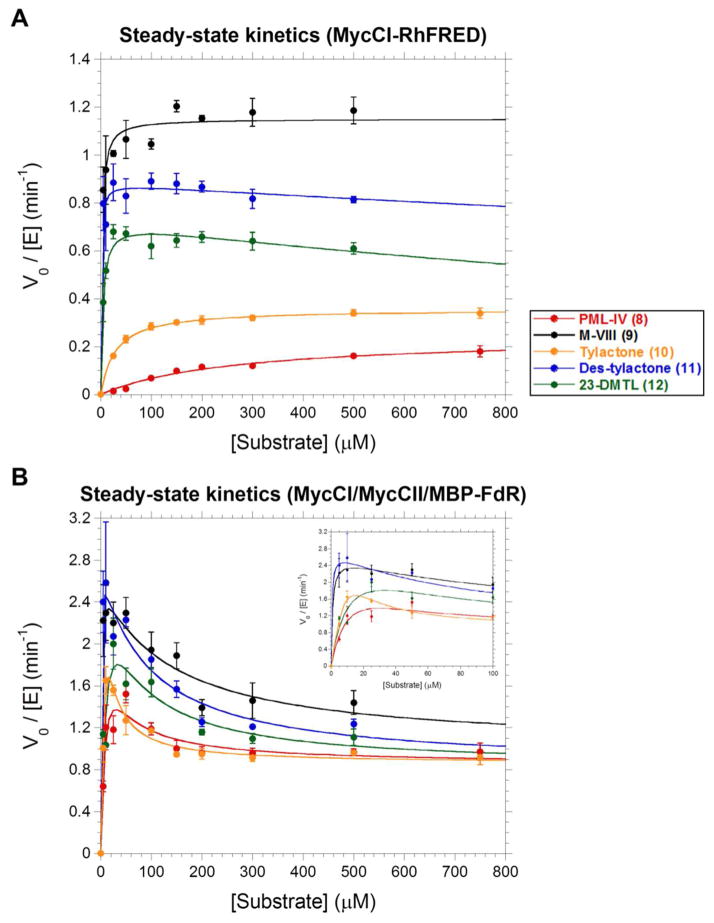
Figure 3.
Steady-state kinetics profiles for (A) MycCI-RhFRED and (B) MycCI in conjunction with MycCII and MBP-FdR. Plots are of initial product formation rate (V0) as assessed by HPLC normalized to the concentration of P450 (0.5 μM) used in the kinetics assays. Mean values and standard deviations (error bars) associated with each data point were calculated from the results of experiments performed at least in triplicate. The data were fit to the Michaelis-Menten equation (MycCI-RhFRED + 8–10) or to equations describing single-site (MycCI-RhFRED + 11, 12) or two-site (MycCI/MycCII/MBP-FdR + 8–12) substrate inhibition as described in Supporting Information. The inset in the bottom graph shows a close-up version of the data at low substrate concentrations (0–100 μM).

