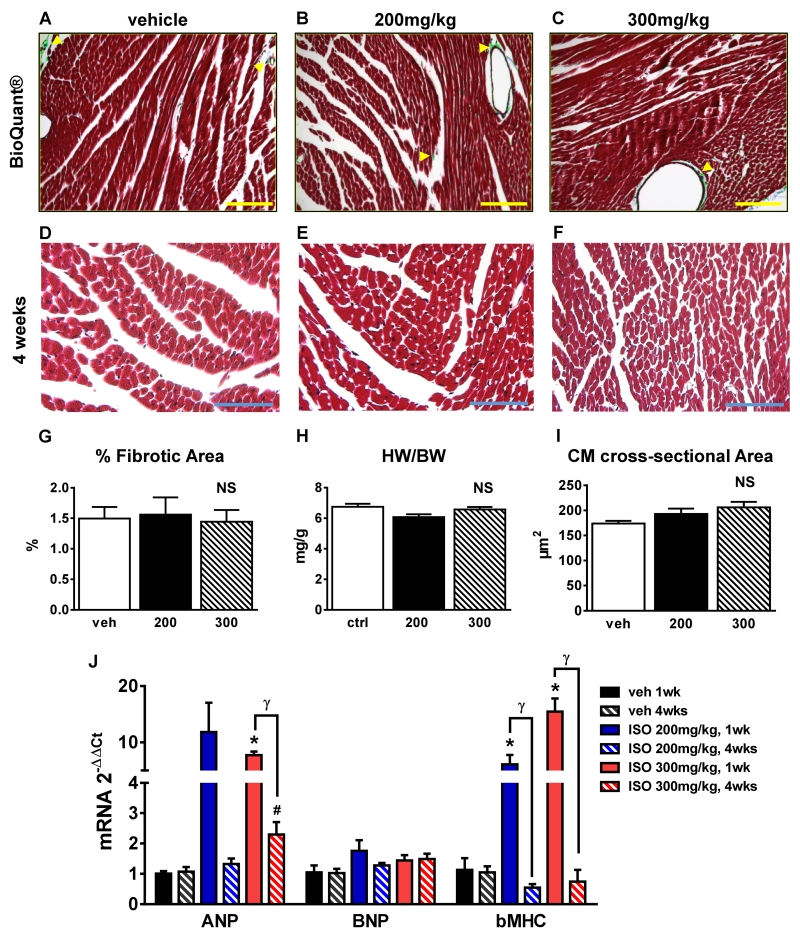
Figure 4. Myocardial fibrosis and hypertrophy.
A-C, Tissue sections from hearts fixed at 4 weeks post-ISO injection (vehicle (A and D); 200mg/kg ISO (B and E), and 300mg/kg ISO (C and F)) were stained with Masson’s trichrome. Bright-field micrographs with bioquantification indicating Masson’s trichrome blue-stained fibrotic areas (green). Scale bars=150μm. D-F, Representative bright-field micrographs of vehicle (D), 200mg/kg ISO (E), and 300mg/kg ISO (F) hearts studied 4 weeks after injection. Scale bars=50μm. G, Percentage of fibrotic area determined by bioquantification (n=9, 3 each group). H, Heart weight/body weight ratio (HW/BW) (n=14). I, Average myocyte cross-sectional area (n=9, 3 each group). J, Atrial natriuretic peptide (ANP), brain natriuretic peptide (BNP), and β-myosin heavy chain (βMHC).
mRNA levels at 1 week (n=11) and 4 weeks (n=12) after vehicle, 200mg/kg ISO, and 300mg/kg ISO. ANP and βMHC expression levels were upregulated at 1 week post-ISO (300mg/kg). *p<0.05 vs. veh 1wk, #p<0.05 vs. veh 4wks, γ p<0.05 1wk vs. 4wks, NS=not significant (p>0.05). G-I, Data are shown as mean ± SEM.

