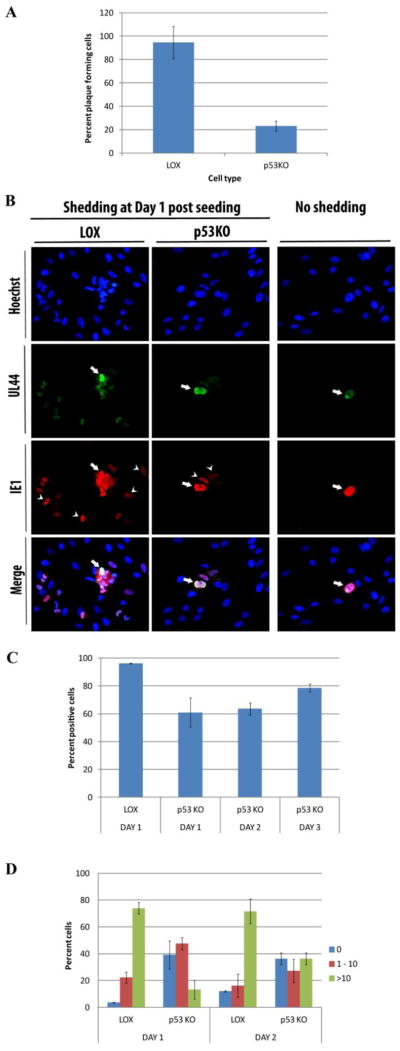
Figure 1.
Quantitation of virion shedding cells in wt LOX cells compared to p53KO cells. Infected LOX and p53KO cells were harvested for seeding onto monolayers at 120 h pi. (A) The mean percentage of cells generating visible plaques in conventional plaque forming assays. Error bars represent one standard error calculated from five experiments. (B) Infectious center assays to more sensitively detect virion shedding. Coverslips were stained for UL44 to detect seeded cells (arrows) and IE1 to detect newly infected neighboring cells (arrow heads). (C) Mean percentage of shedding positive cells detected by immunofluorescent staining of infectious center assays. Error bars represent one standard error calculated from three technical replicates. (D) Quantitation of newly infected neighboring cells at day 1 and 2 post seeding. Mean numbers of infected neighboring cells were binned at 0, 1–10, and more than 10. Error bars represent one standard error calculated from three technical replicates.

