Figure 2.
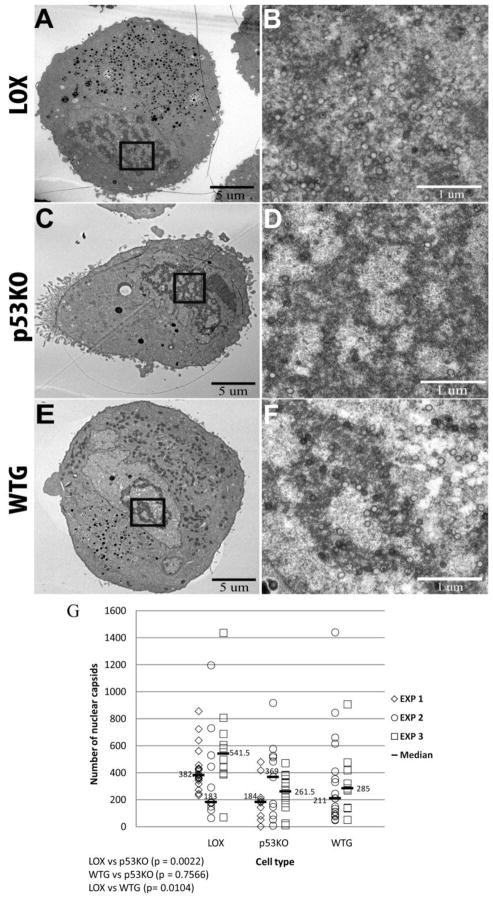
Quantitation of capsid production in the nucleus in wt cell sections compared to p53KO cell sections. TEM micrographs of infected cell sections showed RCs with numerous HCMV capsids at 120 h pi. Cross sections of entire cell sections were captured at a magnification of 1,700X (A, C and E). Examples of nuclear capsids present in the boxed areas in A, C and E as visualized in images captured at 5,000x are shown for LOX (panel B), p53KO (panel D) and WTG (panel F). As necessary, images captured at higher magnification in this and all subsequent figures were stitched together to form a mosaic image of the individual captures from an individual cell section. Capsids were enumerated using these mosaic images. Statistical tests for differences among the EM sections of the LOX, p53KO and WTG cells (all graphs in Figures 2–5 and Supplemental Figures) were conducted using the Kruskal-Wallace test as described in Materials and Methods. If the overall tests were found statistically significant (p-values reported in the figure legends), then pairwise comparisons among the three cell lines were conducted using the same test (and reported within the figures). For all analyses, a p-value of 0.05 or less was considered statistically different. (G) Quantitation of capsids in the nucleus in wt LOX cell sections compared to p53KO and WTG cell sections. Each symbol represents an individual cell section in an experiment in this, and all following figures. Experiment 1 (EXP 1) used LOX cell sections (n=20) compared to p53KO cell sections (n=10). Experiment 2 (EXP 2) used LOX cell sections (n=11) compared to p53KO cell sections (n=11) and WTG cell sections (n=19). Experiment 3 (EXP 3) used LOX cell sections (n=10) compared to p53KO cell sections (n=12) and WTG cell sections (n=11). Median capsid counts for each cell type in a given experiment are marked with a horizontal bar in this, and all following figures. Kruskal-Wallace overall test, p=0.0025.

