Figure 4.
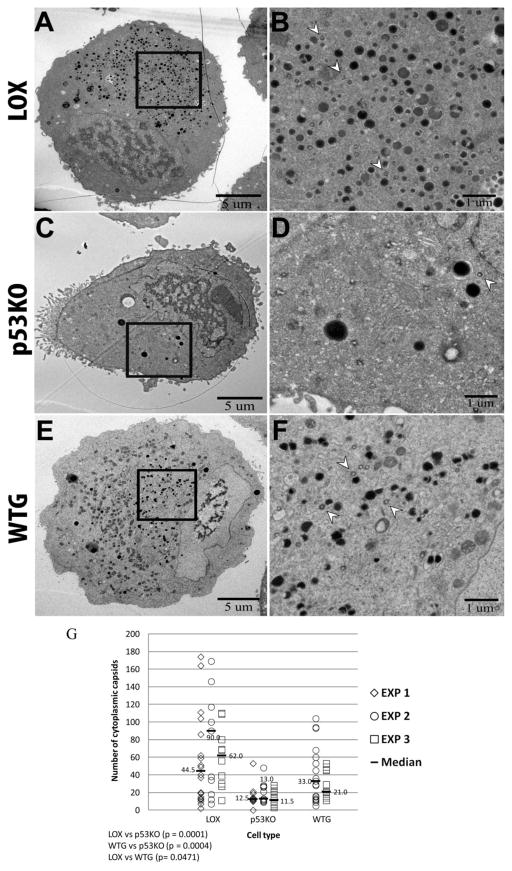
Quantitation of cytoplasmic capsids. Whole cell sections were captured at a magnification of 1,700X (A, C, and E). Images captured at higher magnification (2500x) were used to quantitate cytoplasmic capsids. Arrow heads in B, D and F show examples of cytoplasmic capsids present within the boxed areas in A, C and E, as visualized in 2,500x images. (G) Quantitation of capsids in the cytoplasm in LOX, p53KO and WTG cell sections. Kruskal-Wallace overall test, p<0.0001.

