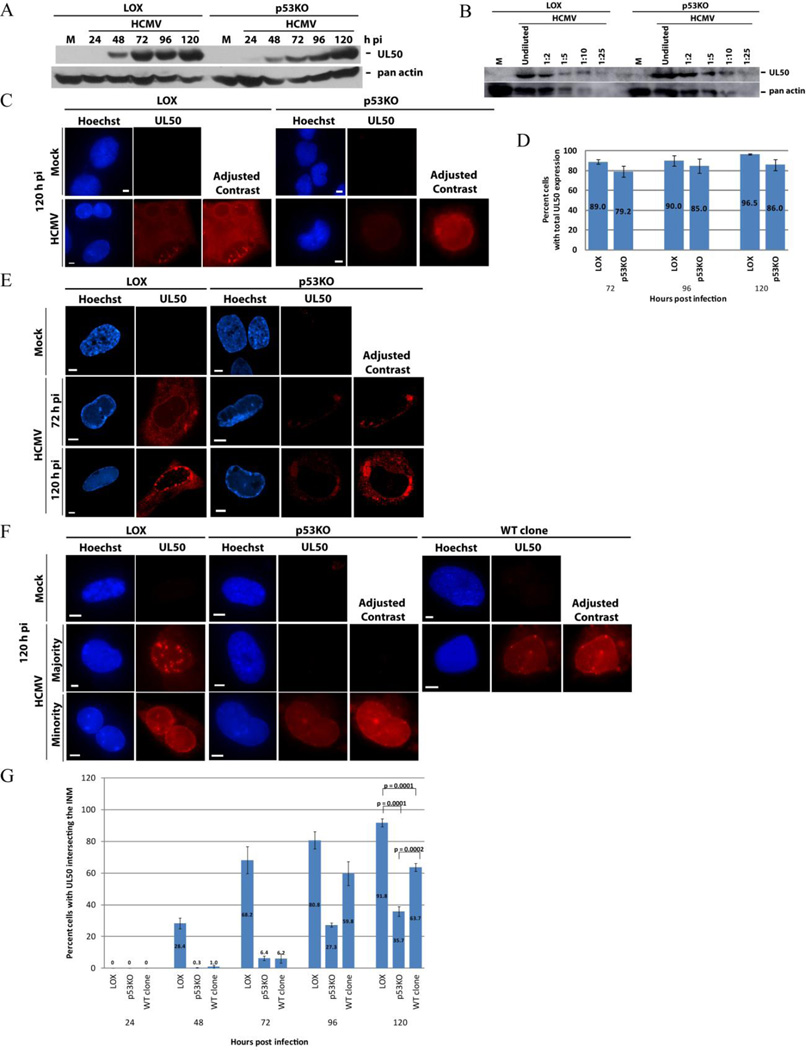
Figure 3. UL50 protein presence and localization in p53KO cells.
(A) Western blot analysis of UL50 in LOX and p53KO cells over a representative timecourse of infection. (B) Western blot showing a dilution series of LOX and p53KO cells at 120 h pi. Undiluted sample used lysate derived from an equivalent cell number as samples in (A). (C) Fix-first IF of total (nuclear and cytoplasmic) UL50 protein staining of both cell types at 120 h pi. Note the UL50 signal was less robust in the p53KO cells and therefore both cell types are shown with enhanced contrast (+50) for ease of visualization. (D) Quantitation of the percentage of cells displaying overall UL50 protein expression at late times pi. Error bars represent one standard error calculated from at least 2 experiments. (E) Confocal IF images of UL50 staining in LOX and p53KO cells at 72 and 120 h pi using a fix-first protocol. UL50 signal was concentrated at the nuclear rim in the majority of LOX cells and in the cytoplasm of the majority of p53KO cells. p53KO cells are again shown with enhanced contrast (+80). (F) UL50 localization was analyzed by IF using an extract-first protocol in all cell types at 120 h pi. The minority UL50-expressing p53KO cells required image contrast enhancement (+75) in order to clearly display its expression and localization. More WT-clone cells exhibited UL50 nuclear rim staining, but the signal was weaker and fewer puncta were present compared to LOX cells. Enhanced contrast (+75) is also shown for WT clone cells. (G) Quantitation of extract-first IF UL50 signal embedded into the INM for each cell type over a timecourse of infection. Error bars represent one standard error calculated from at least two experiments.

