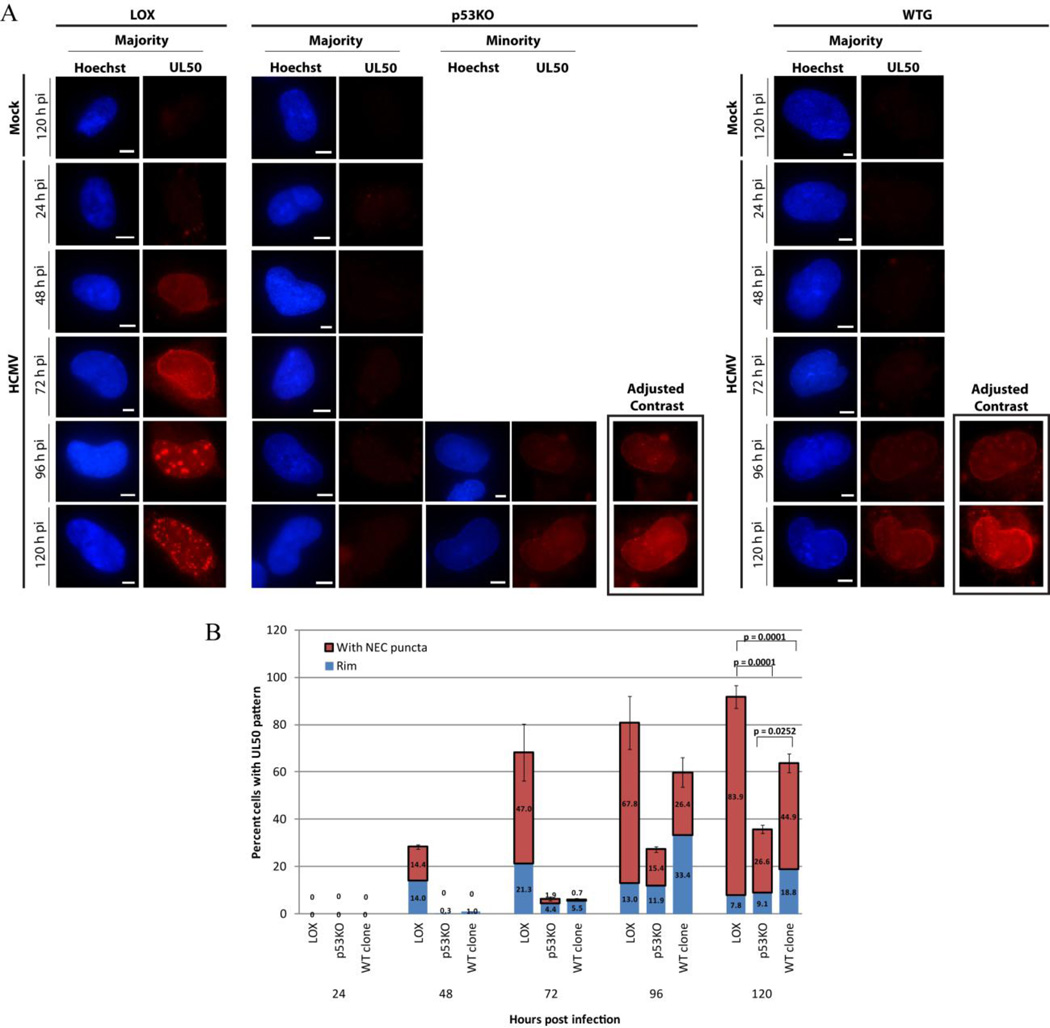
Figure 6. UL50 staining progressed to a punctate pattern.
(A) Epifluorescent IF extract-first images of UL50 staining for all three cell types over a timecourse of infection. p53KO and WT-clone cells are additionally shown with enhanced contrast (+75) to aid in visualization. (B) Quantitation of IF staining for each cell type of UL50+ intersecting the INM (rim) and UL50-puncta+ (with NEC puncta) over a timecourse of infection. Blue portion of bars represents percentage of cells with UL50 intersecting the INM of the nucleus (at Rim). Red portion of the bars represents the percentage of cells with UL50 at the rim and with additional puncta (with NEC puncta). Error bars represent one standard error for the red portion of each bar only calculated from at least two experiments. Significance calculations represent p-values for the red portions of the bars only, which represent at least five experiments.

