Figure 2.
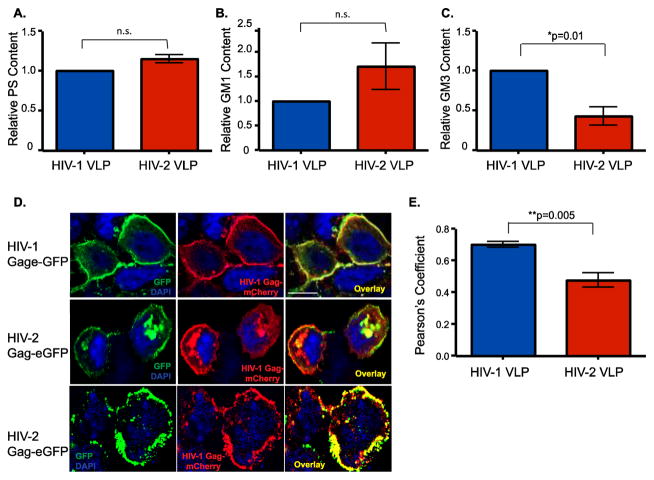
Decreased Incorporation of GM3 in HIV-2 Gag-eGFP VLPs. Phosphatidylserine (PS) (A) and GM1 (B) content of HIV-1 and HIV-2 Gag-eGFP VLPs was determined by multi-spectral plasmonic nanocoupling analysis; n.s. = not significant (C) GM3 content in HIV-1 and HIV-2 Gag-eGFP VLPs was determined by an ELISA. Values for HIV-2 Gag-eGFP VLPs were normalized to those observed with HIV-1 Gag-eGFP VLPs (set as 1) and is the mean of 3 (for PS and GM1) and 4 (GM3) independent measurements ± SEM. *p=0.01. (D) HEK293T cells were co-transfected on glass cover slips with HIV-1 Gag-eGFP or HIV-2 Gag-eGFP expression plasmids with HIV-1 Gag-mCherry expression plasmid. Cells were counterstained with DAPI to visualize nuclei. The left panel shows expression of the HIV-1 or HIV-2 Gag-eGFP, middle panel shows the HIV-1 Gag-mCherry expression and the right panel is the overlay. (E) Co-localization between green (Gag-eGFP) and red (Gag-mCherry) is reported as mean Pearson’s coefficient of co-localization ± SEM. **p=0.005.

