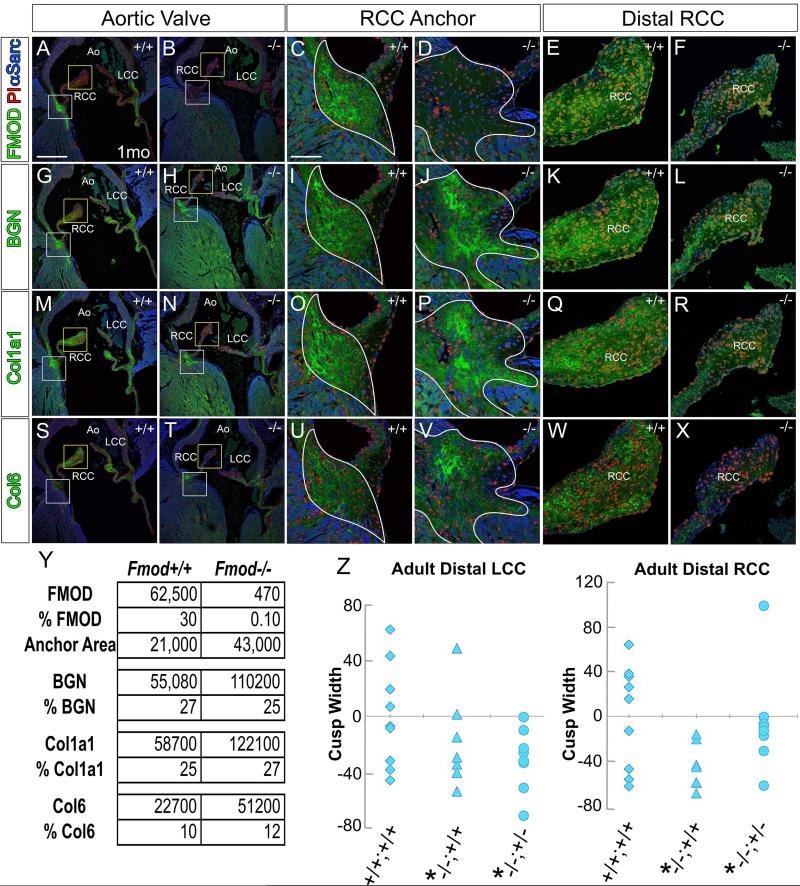
Fig. 2. Immunostaining of myotendinous junction components biglycan, fibromodulin, Collagen, type I, alpha1 and Collagen 6 was expanded in 1 month Fmod−/− hearts where aortic valve cusps anchor compared to wild type.
Immunolocalization of fibromodulin (FMOD, green, A-F), biglycan (BGN, green, G-L), collagen, type I, alpha1 (Col1a1, green, M-R), and collagen 6 (Col6, green, S-X) in Fmod+/+ (A, C, E, G, I, K, M, O, Q, S, U, W) and Fmod−/− (B, D, F, H, J, L, N, P, R, T, V, X). White boxes in A, B, G, H, M, N, S, T are magnified in panels C, D, I, J, O, P, U, V respectively and show the right coronary cusp (RCC) anchor. The yellow boxes in A, B, G, H, M, N, S, T are magnified in panels E, F, K, L, Q, R, W, X respectively and show the distal RCC. White outline (C, D, I, J, O, P, U, V) –collagen-rich region where the RCC anchors. Red- propidium iodide (PI); blue- α-sarcomeric actin (αSarc); LCC- left coronary cusp; Ao- aorta. Scale bars: A= 400μm applies to B, G, H, M, N, S, T; C= 50μm applies to D-F, I-L, O-R, U-X. Table in Y denotes the average area of the anchor region and positive pixels of each ECM components in 1 mo Fmod−/− hearts. Scatterplots in Z represent the average width of the RCC and LCC respectively of mice 3 months and older. Each symbol represents the average of one heart through 60μm. *-statistical significance P < 0.05.

