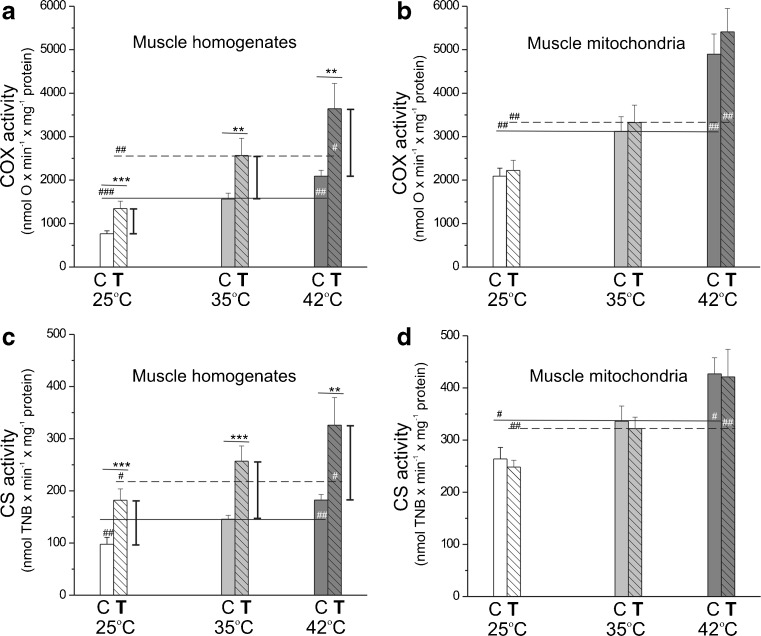
Fig. 1.
The influence of endurance exercise training on maximal COX (a, b) and CS (c, d) activities at 25, 35, and 42 °C. Measurements were performed in skeletal muscle homogenates (a, c) and isolated mitochondria (b, d). Data are represented as the mean ± SD (n = 18) and are from six independent muscle homogenate preparations or mitochondrial preparations (triplicate assays for each condition). Number signs, comparison vs. value obtained at 35 °C for control (C) or trained (T) group. Asterisks, comparison vs. value obtained for control rats. Range of changes between control and trained rats are shown as vertical lines

