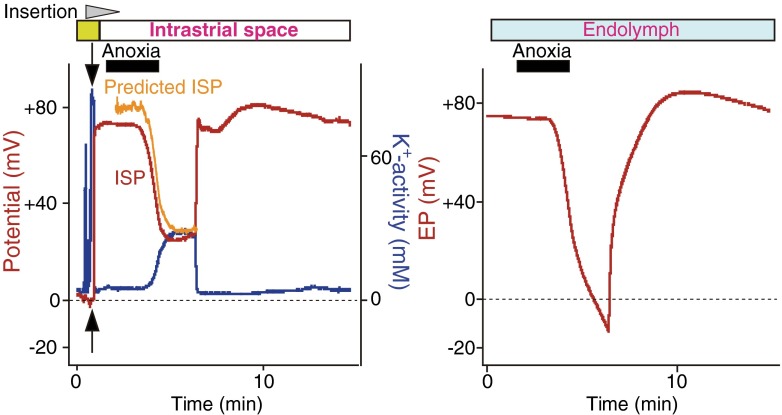
Fig. 2.
Effects of anoxia on the electrochemical properties of IS and EP. In the left panel, a double-barreled microelectrode sensitive to potential (red) and K+ (blue) was inserted in vivo from the perilymph (outset of the traces) toward the endolymph across the lateral wall of cochlea during the time interval marked with the wedge filled with gray (top of the panel). K+ concentration is indicated as K+ activity (aK+). Location of the tips of the electrodes is shown by bars at the top of the panels. After passing the syncytial layer (green bar above the trace; see also Fig. 1c), the electrode encountered the intrastrial space (IS). The EP was simultaneously monitored with a different glass microelectrode placed in the endolymph (right panel). Anoxia was imposed on the animal during the period indicated by bars filled with black above the traces. The values of the IS potential (ISP) were calculated from the measurements of aK+ in the IS (aK+ IS) and aK+ and the potential of the syncytial layer (aK+ SY and v SB, arrows in the left panel) with the equation ISP = v SB + RT/F ln(aK+ IS/aK+ SY). The predicted ISP (orange) was in agreement with the measured ISP (left panel). Note that the EP (right panel) was suppressed more strongly than the ISP (left panel) during anoxia. Reproduced and modified from [74]

