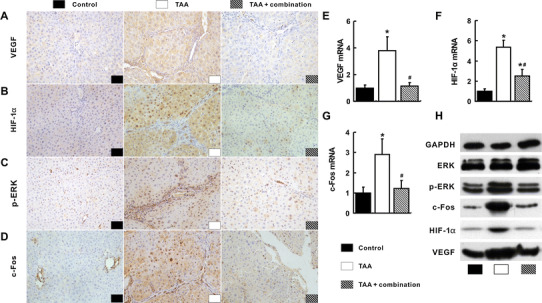
Fig. 4.

Suppression of the integrated signal pathways with the combination treatment in the liver. Most positive staining of VEGF (a), HIF-1α (b), p-ERK (c) and c-Fos (d) visualized by IHC were observed in the TAA group. Consistently, VEGF (e), HIF-1α (f) and c-Fos (g) mRNA and protein (h) and p-ERK protein (h) in the TAA group were the highest among three groups. *p < 0.05 versus control group; # p < 0.05 versus TAA group
