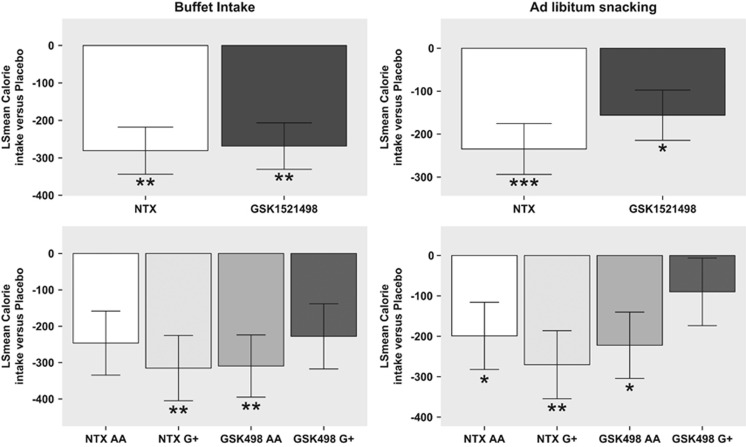
Figure 4.
Treatment and genotype effects on ad libitum calorie consumption. (Top left) Treatment effects of GSK1521498 and NTX (least square mean difference compared with placebo; y axis) in the ad libitum buffet paradigm on average over genotype. (Top right) Treatment effects of GSK1521498 and NTX (least square mean difference compared with placebo; y axis) in the ad libitum snacking paradigm on average over genotype. (Bottom left) Treatment effects of GSK1521498 and NTX (least square mean difference compared with placebo; y axis) for the buffet paradigm, plotted separately by genotype (AA or G+). (Bottom right) Treatment effects of GSK1521498 and NTX (least square mean difference compared with placebo; y axis) for the snacking paradigm, plotted separately by genotype (AA or G+). Statistically significant effects are highlighted: *P<0.05, **P<0.01, ***P<0.001 for treatment versus placebo.

