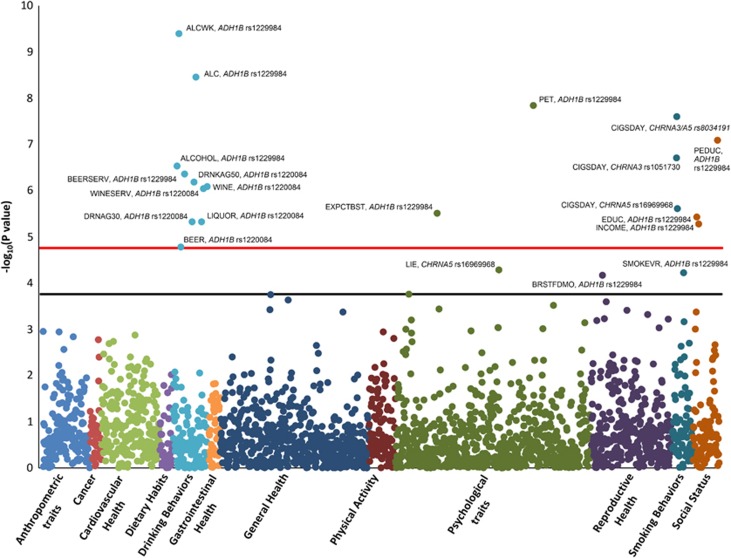
Figure 1.
Manhattan plot of the trans-population meta-analysis including both smoking and alcohol-associated alleles. Red and black lines indicate the phenome-wide and the suggestive significance thresholds (p<1.74*10−5 and p<1.74*10−4, respectively). Phenotype abbreviations are defined in Supplementary Table 2. A full color version of this figure is available at the Neuropsychopharmacology journal online.

