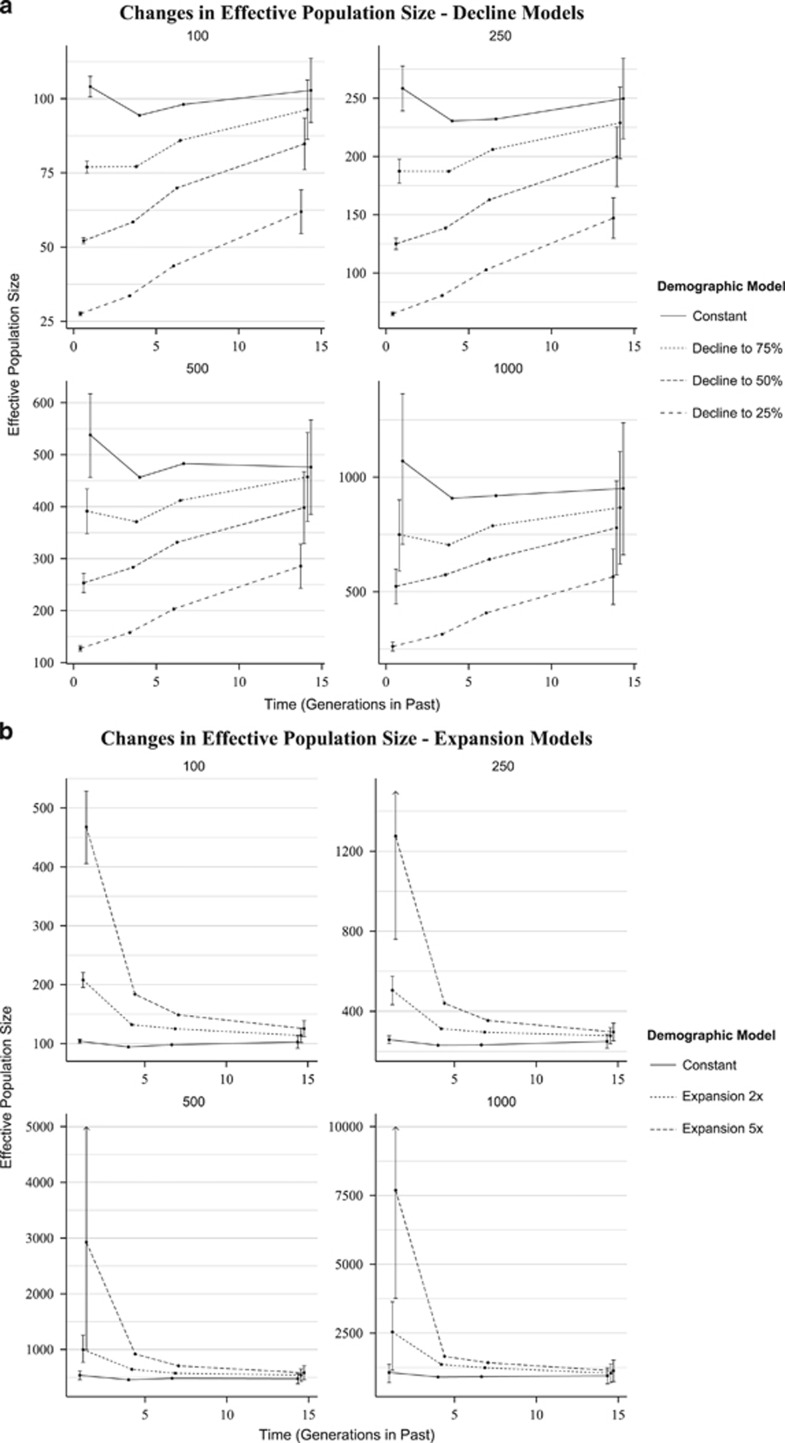
Figure 1.
Estimates of Ne over time in the past for various demographic models, produced with LinkNe. Each panel represents a different starting effective population size (Ne). Confidence intervals are shown only for estimates from the most recent and most distant past. Time points within a plot are adjusted horizontally so that confidence intervals could be distinguished. (a) Trend lines for constant and decline models. (b) Trend lines for constant and expansion models. Upper confidence limits for estimates of Ne for the expansion to 5 × model and for starting Ne of 250, 500 and 1000 were truncated for clarity and are marked with an arrow to indicate that the interval extends beyond the limits of the plot.

