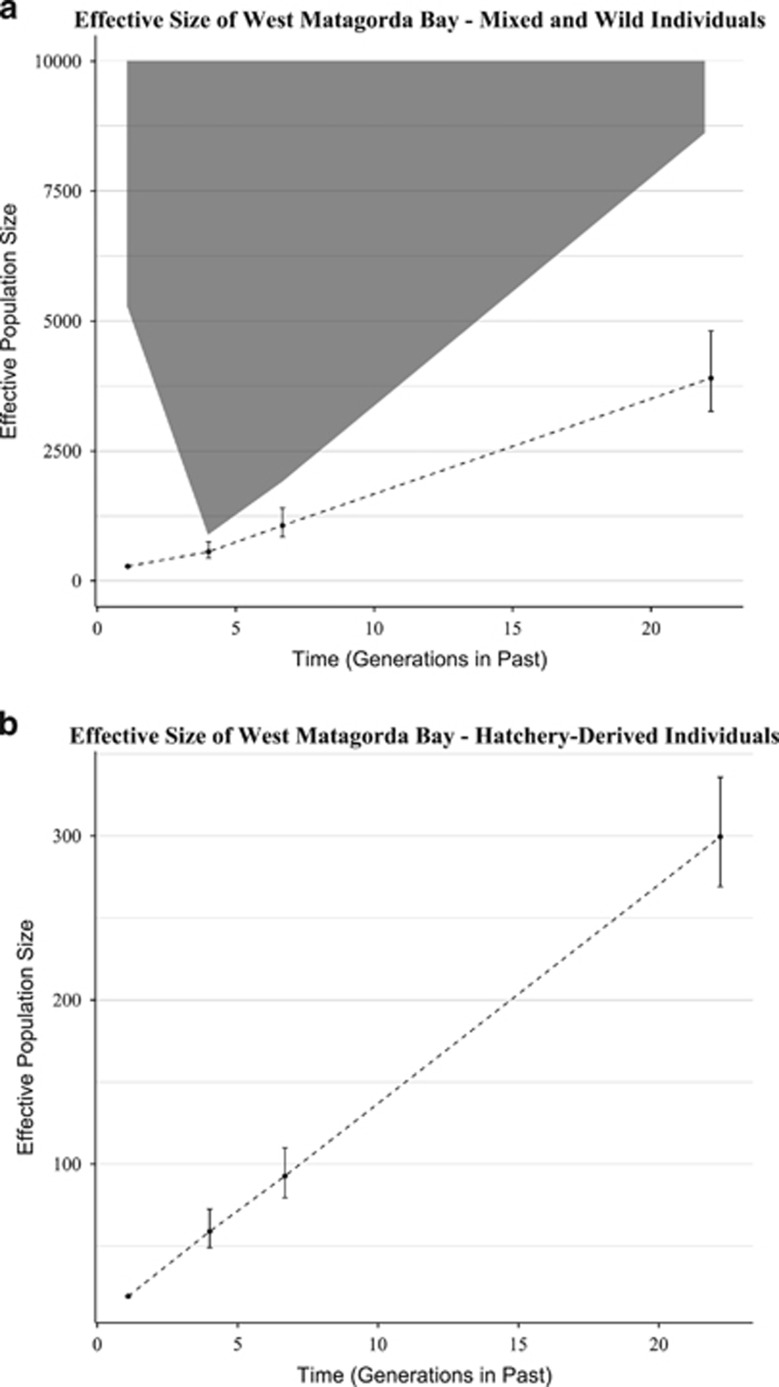
Figure 6.
Results of analysis, using LinkNe, of a sample of red drum juveniles from Matagorda Bay, TX. (a) Trend line (dashed) for Ne produced using all sampled individuals and confidence interval (CI) of Ne when F1 hatchery individuals are removed (shaded area). Note that when ‘wild' individuals are assessed, only the lower bounds of the CI are estimable from the data; for clarity, the CI is truncated at 10 000. (b) Trend line for F1 hatchery-raised individuals, indicative of a large decline in Ne in the parental generation that consisted of hatchery brood stock.

