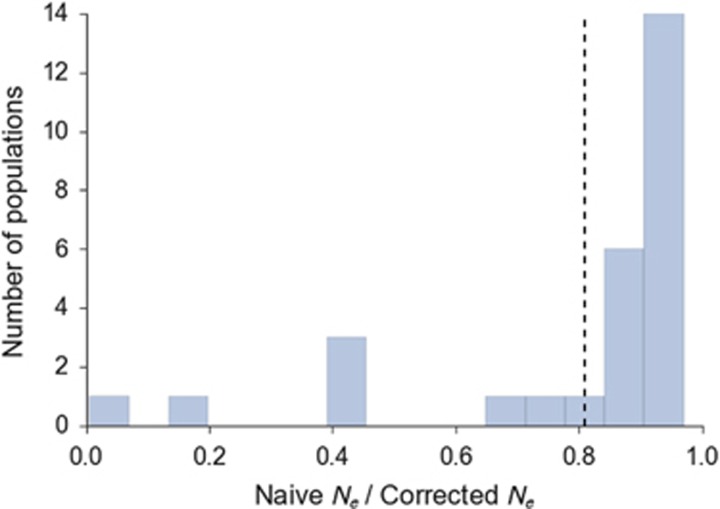
Figure 6.
Effect of removing within-chromosome LD from Ne estimates in 28 Atlantic salmon populations. Values on x axis are the ratio of N̂e for naive (all locus comparisons) and corrected comparisons (only among loci on different chromosomes). Dashed line shows the predicted correction level based on 29 chromosomes.

