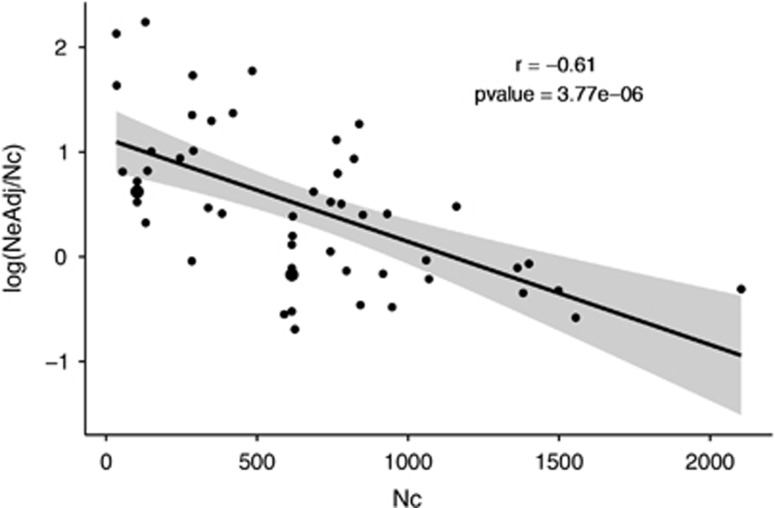
Figure 2.
Relationship between log(NeAdj/Nc) and Nc. Each dot represents a single sample (one population for a specific year) and the line was fitted with a linear regression including the 95% confidence interval (display in gray area Pearson's correlation coefficient and the associated P-value are also reported.

