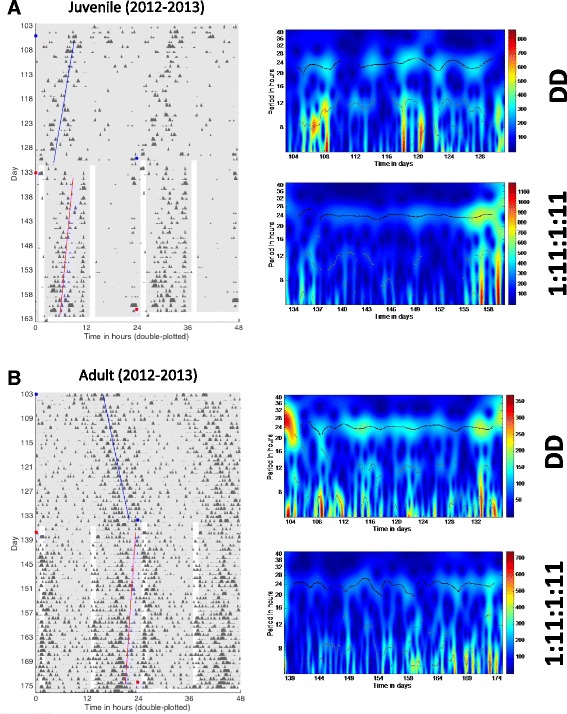
Fig. 5.

Actograms and scalograms of a juvenile (a) and adult (b) captive grizzly bear during winter dormancy under DD conditions or when exposed to a symmetrical (1 h light/11 h dark) twice daily light regimen (1:11:1:11). Blue and magenta lines represent the fitted midpoints of activity during each successive period. These are not the same bears shown in Figs. 1 and 2. Note the shorter FRP in the juvenile bear (blue line angled left) compared to the longer FRP in the adult bear (blue line angled right); a 24 h FRP would be represented by a completely vertical line
