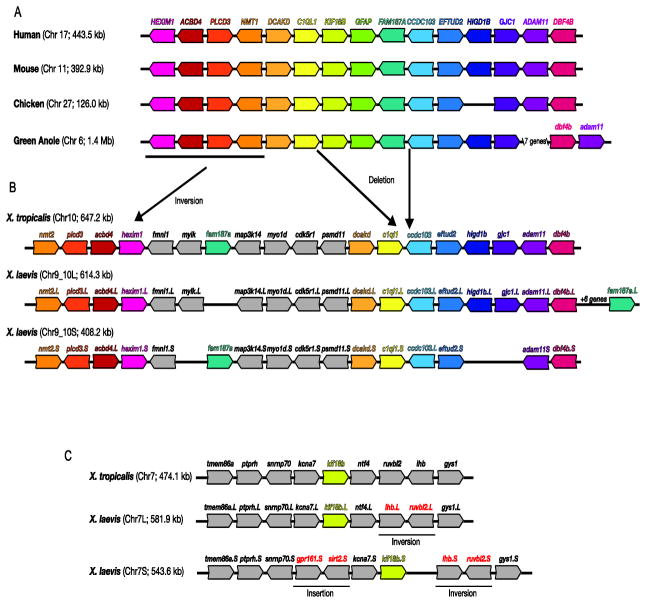
Figure 3. Syntenic analyses of gfap genomic regions.
The genomic regions surrounding gfap genes in select vertebrates are illustrated. For clarity, homologous genes have been similarly colored. Non-coding RNAs and pseudogenes were not included. Although human FAM187a is not annotated on the most recent reference assembly (GRCh38), it was included on previous assemblies and its location is included here. Chromosome number as well as the size of the regions depicted in the schematic are shown in parenthesis. The reverse complement of sequences were used so the gfap gene appears 5′ (left) to 3′ (right) in all species. The location of hypothesized deletions, duplications and inversions are also illustrated. The sequence source and locations used to build these syntenic schematics can be found in Table S4.

