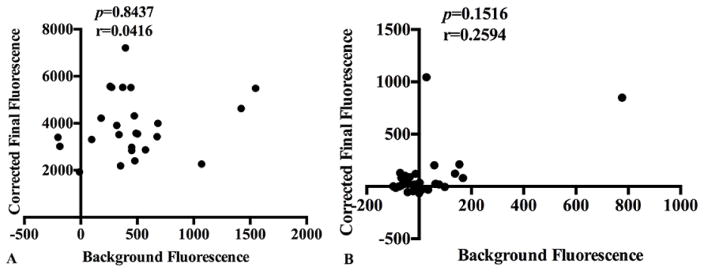
Figure 3. Bland-Altman plots to evaluate for fixed bias in LPS measurements in the Etarfolatide study samples.
A) Using Etarfolatide study serum samples (n=25), at 0.1% dilution, the corrected final fluorescence (y-axis) resulting from the LPS assay results no systematic positive correlation with background fluorescence (x-axis) (p=0.8437) demonstrating no fixed bias could be discerned in LPS results derived from samples diluted 0.1%. B) Using Etarfolatide study synovial fluid samples (n=31), at 0.1% dilution, the corrected final fluorescence (y-axis) resulting from the LPS assay showed no systematic positive correlation with background fluorescence (x-axis) (p=0.1516) demonstrating no fixed bias could be discerned in LPS results derived from samples diluted 0.1%.

