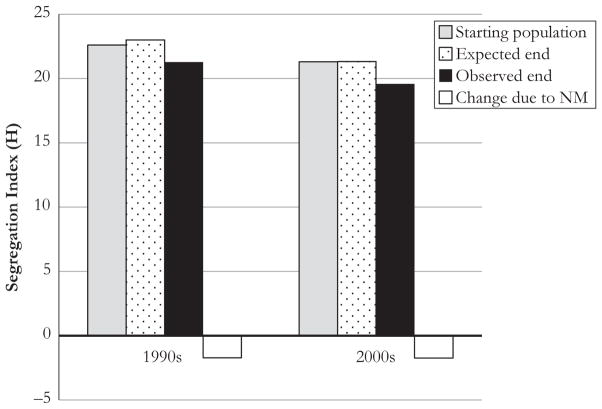
Fig. 2.
Multigroup county-level segregation index (H), 1990–2010. Figure 2 shows the authors’ calculations of the Theil’s H multigroup segregation index as observed at the beginning of decade (light gray), expected at end of decade had there been no net migration (dots), observed at end of decade (solid black), and the change in segregation due to net migration (NM) during the decade (solid white)

