
Fig. 3.
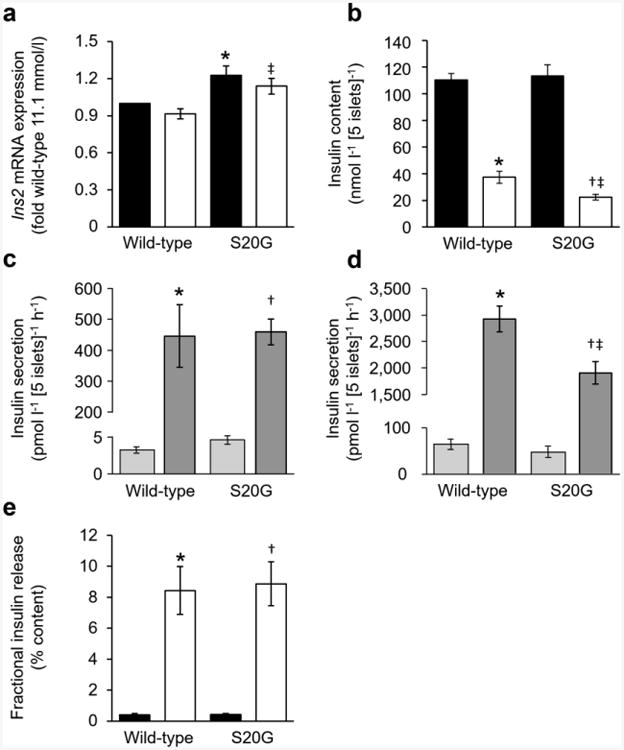
Insulin assessments of isolated wild-type and S20G hIAPP islets. (a, b) Insulin mRNA (a) and insulin content (b) of islets measured after 144 h culture in media containing either 11.1 or 16.7 mmol/l glucose followed by 2.5 h in 2.8 mmol/l glucose. Black bars, 11.1 mmol/l glucose; white bars, 16.7 mmol/l glucose. (c, d) GSIS in response to 1 h of 2.8 or 20.0 mmol/l glucose following 144 h culture in media containing either 11.1 mmol/l glucose (c) or 16.7 mmol/l glucose (d). Light grey bars, 2.8 mmol/l glucose; dark grey bars, 20.0 mmol/l glucose. (e) GSIS normalised to insulin content. Black bars, 11.1 mmol/l; white bars, 16.7 mmol/l. n=5 experiments, except mRNA n=7. *p≤0.05 vs wild-type islets cultured in 11.1 mmol/l glucose; †p≤0.05 vs S20G islets cultured in 11.1 mmol/l glucose; ‡p≤0.05 vs wild-type islets cultured in 16.7 mmol/l glucose. Secretion experiments: *p≤0.05 vs wild-type islets exposed to 2.8 mmol/l glucose; †p≤0.05 vs S20G islets exposed to 2.8 mmol/l glucose; ‡p≤0.05 vs wild-type islets exposed to 20.0 mmol/l glucose