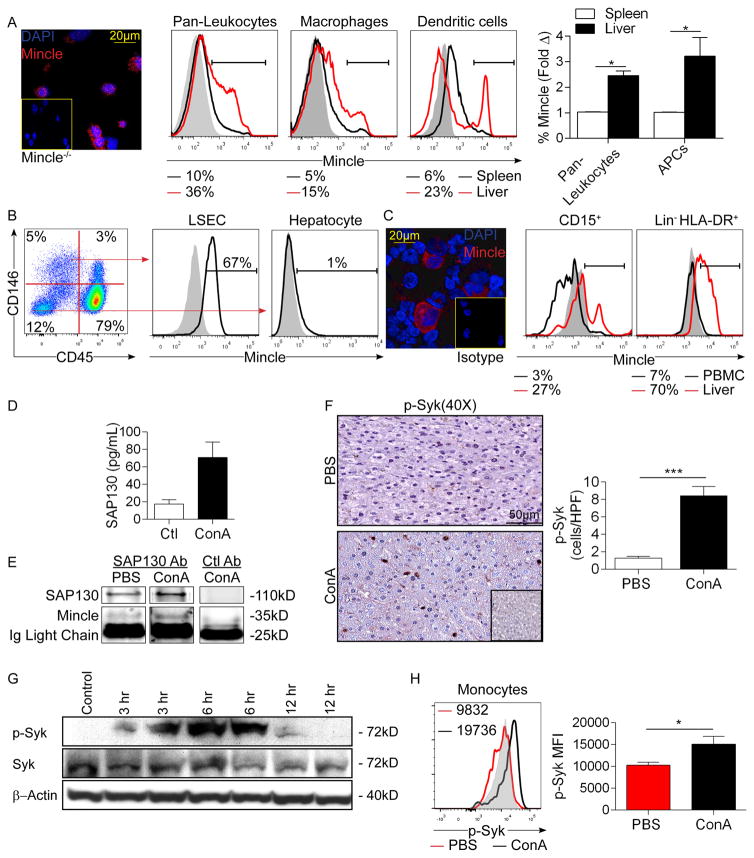
Figure 1. High Mincle expression and signaling in Con-A hepatitis.
(a) Mincle expression was assayed in mouse liver NPC by confocal microscopy compared with NPC from Mincle−/− liver. Mincle expression was also compared by flow cytometry in mouse liver and spleen CD45+ pan-liver leukocytes, Gr1−CD11b+F480+ macrophages, and F480−CD11c+MHCII+ dendritic cells. Representative histograms and quantitative data from 4 mice are shown. Grey histograms represent isotype controls. (b) Mincle expression was tested in murine CD45−CD146+ liver sinusoidal endothelial cells and CD45−CD146− hepatocytes by flow cytometry. Representative data indicating the percentage of positive cells relative to isotype control is shown. (c) Mincle expression was assayed in human liver NPC by confocal microscopy. Mincle expression was further tested by flow cytometry in human CD15+ liver monocytes and Lin−HLA-DR+ liver dendritic cells compared with their counterparts in PBMC. Representative histograms are shown. Similar results were obtained from 5 separate patients. (d) Mice were treated with Con-A (20μg/g) or PBS and livers were harvested and tested for SAP130 expression by ELISA at 12h (n=3). (e) Lysates from PBS- or Con-A-treated mice were immuno-precipitated using an α-SAP130 or control mAb and then tested for expression of SAP130 and Mincle. (f) Paraffin-embedded sections from livers of WT mice treated with PBS or Con-A were assayed for expression of p-Syk by immunohistochemistry at 12h. Isotype control is shown. Representative images and quantified data are shown (n=3/group). (g) The time course of Syk activation in Con-A hepatitis was tested by western blotting using liver lysate from 2 mice at each time point. β-actin was used as a loading control. (h) Inflammatory monocytes from the liver of PBS- and Con-A-treated mice were tested for expression of p-Syk at 12h after injury. Representative histograms and quantitative data from 3 mice based on median fluorescent indices (MFI) are shown (*p<0.05, ***p<0.001). All experiments were repeated at least twice with similar results.

