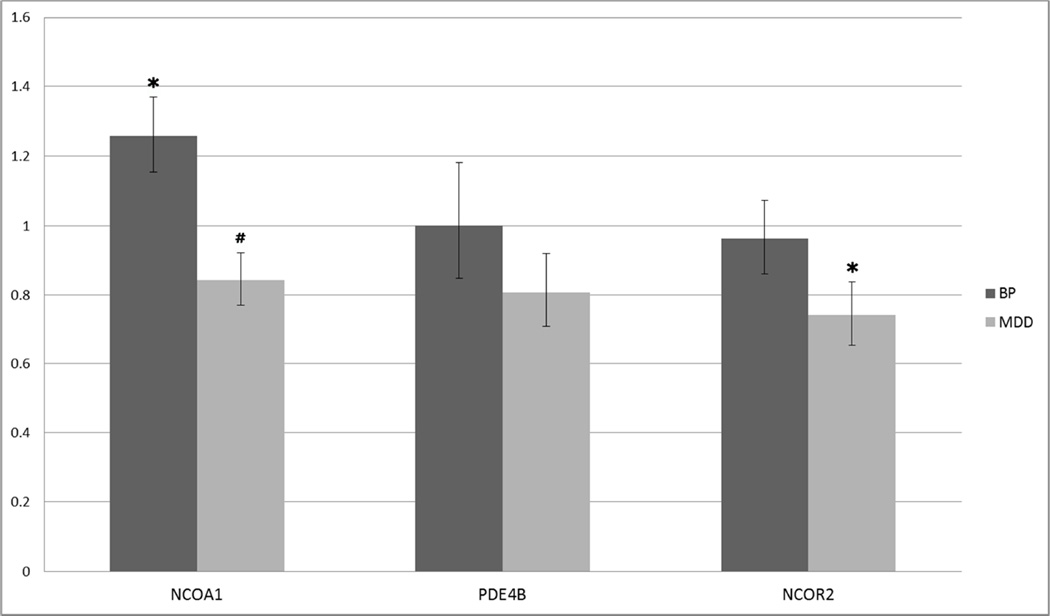
Figure 3. Steady-state mRNA levels of validated targets are altered in BP and MDD patients.
The mRNA levels of NCOA1 and NCOR2 were dysregulated specifically in the BP and MDD cohorts, respectively. The same patient cohorts were used in both miRNA and mRNA expression analyses (BP: n=8; MDD: n=15 ; Control: n=14). Vertical axis represents linear fold change in BP or MDD patients versus controls. mRNA expression levels were analyzed using single-tube TaqMan qPCR assays specific to the genes of interest. Bars represent linear fold changes in BP and MDD cohorts compared to control patients with error bars representing SEM. (*: P < 0.05, #: P ≤ 0.10)

