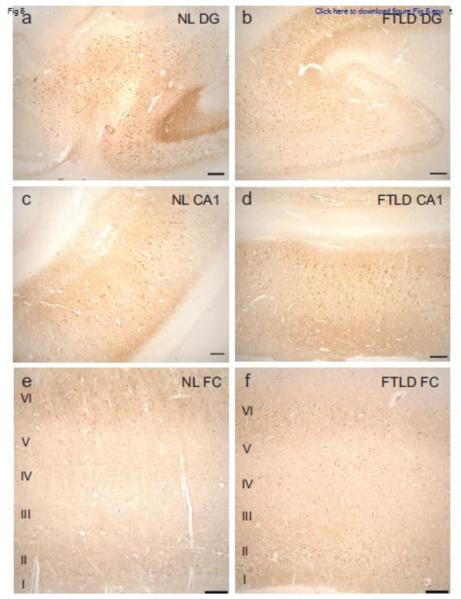
Fig. 5.
Calcineurin distribution in the hippocampus and frontal cortex is similar in FTLDTDP and normal subjects. Representative photomicrographs depicting calcineurin immunoreactivity in the dentate gyrus (a,b), hippocampal CA1 field (c,d), and frontal cortex (e,f) of a normal control subject (a,c,e) and a subject with FTLD-TDP (b,d,f). Scale bar: 250 μm.

