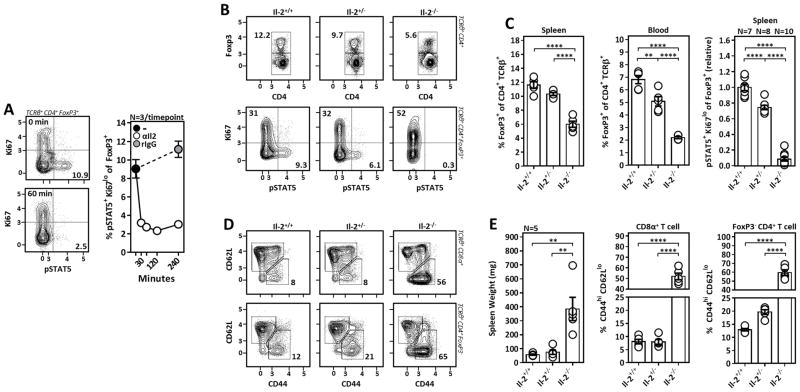
Figure 1. Tr cells compete for a limiting supply of Il-2.
(A) Rat IgG or Il-2 blocking antibody (S4B6-1) was administered to mice I.V. at the indicated time-points prior to sacrifice to assess Il-2 activation kinetics in splenic Tr cells by phosphorylation of STAT5 (pSTAT5). (B and D) Representative flow cytometry plots assessing Tr cell frequencies and pSTAT5 (B), and activation of FoxP3− T cells (D), in WT (Il-2+/+) Il-2 heterozygous (Il-2 +/−) and Il-2 knockout (Il-2−/−) mice. (C) Tr cell frequencies amongst TCRβ+ CD4+ T cells in the spleen (left) and blood (middle) of Il-2+/+, +/−, and −/− mice (N = 5). (Right) Compiled data for Tr cell pSTAT5 in mice of the indicated genotype (N = replicate mice per group). (E) Spleen weight (left) and frequency of activated (CD44hi CD62Llo) CD4+ and CD8+ T cells as gated in D (N=5). Data representative of at least 2 independent experiments. Error bars in all panels represent mean ±SEM. **, P ≤ 0.01; ***, P ≤ 0.001; ****, P ≤ 0.0001, as calculated by one-way ANOVA with Tukey’s post hoc test.

