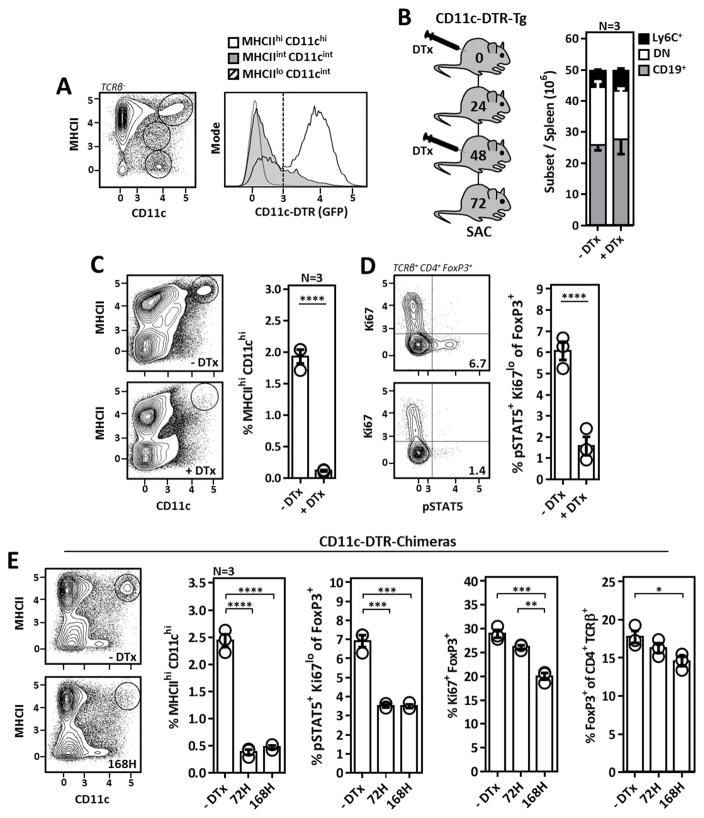
Figure 3. DCs are required for the homeostatic maintenance of Il-2-dependent Tr cells.
(A) Flow cytometric analysis of GFP (DTR) expression in various splenic cell populations from CD11c-DTR-Tg mice. (B) Strategy for the elimination of DCs in CD11c-DTR-Tg mice (left) and broad cellular subset composition of splenocytes from CD11c-DTR-Tg mice ±DTx treatment (right). (C) Analysis of MHCIIhi CD11chi DCs in CD11c-DTR-Tg mice ±DTx treatment. (D) Il-2 activation (pSTAT5) in Tr cells from CD11c-DTR-Tg mice ±DTx treatment. (E) Analysis of the DC and Tr cell compartment in CD11c-DTR-Chimeric mice treated ±DTx for 3 or 7 days. Tr cell Il-2 activation (pSTAT5), proliferation (Ki67), and frequency amongst TCRβ+ CD4+ T cells are plotted. Error bars in all panels represent mean ±SEM. *, P ≤ 0.05; **, P ≤ 0.01; ***, P ≤ 0.001; ****, P ≤ 0.0001, as calculated by unpaired students Student’s t-test (C, D) or one-way ANOVA with Tukey’s post hoc test (E).

