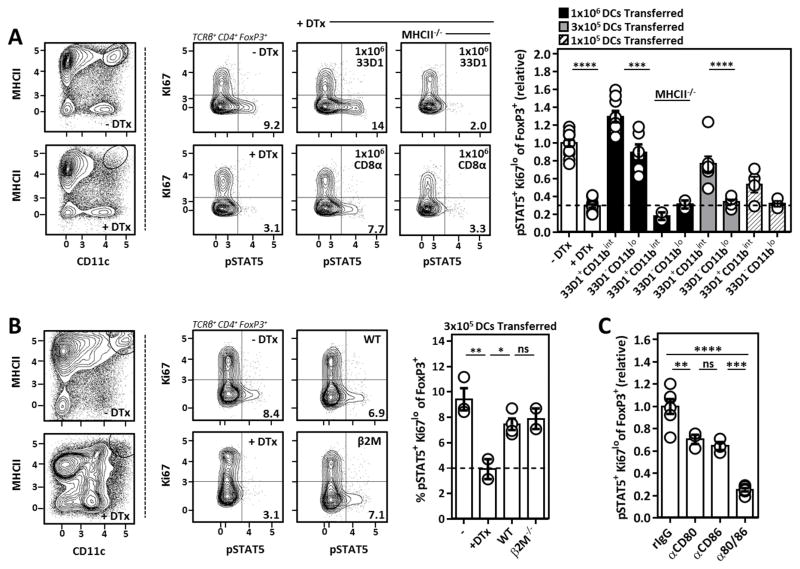
Figure 6. Sufficiency of DC subsets and their molecular requirements for the maintenance of Il-2-dependent Tr cells in vivo.
(A) Representative flow cytometry and compiled data comparing Tr cell Il-2 activation (pSTAT5) from DC-deplete mice receiving varying amounts of adoptively transferred DCs of the indicated subset and genotype. Numbers listed above bar graphs indicate number of DCs used for the adoptive transfer. Data pooled from 4 independent experiments and pSTAT5 normalized to the untreated control Tr cells within each experiment. (B) Il-2 activation (pSTAT5) in Tr cells from DC-depleted mice receiving 3x10⁵ WT or β2M−/− 33D1+ CD11bint DCs. (C) Mice were treated with a single dose of 100μg of the indicated antibodies 48H prior to sacrifice. Histogram represents Tr cell Il-2 activation (pSTAT5) in mice receiving CD80/CD86 antibodies individually or in tandem. Error bars in all panels represent mean ±SEM. *, P ≤ 0.05; **, P ≤ 0.01; ***, P ≤ 0.001; ****, P ≤ 0.0001, as calculated one-way ANOVA with Tukey’s post hoc test. ns, not significant.

