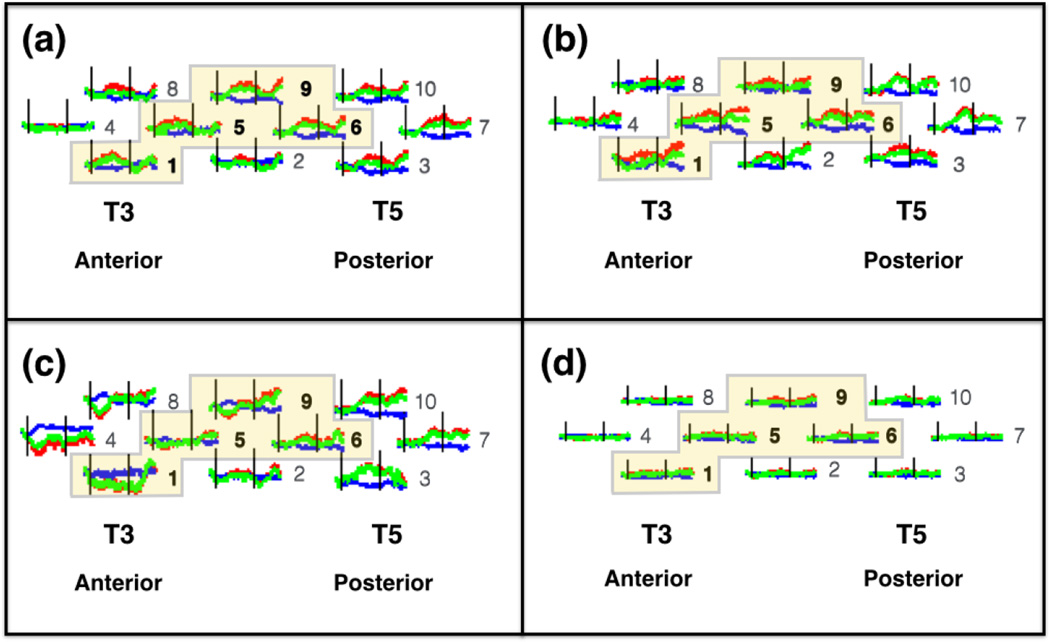
Figure 6.
Mean hemodynamic responses in the left hemisphere of infants in each condition: (a) human hand, function; (b) human hand, non-function; (c) mechanical hand, function; and (d) mechanical hand, non-function. T3 and T5 correspond to the International 10–20 coordinates, and T3 served as our left hemisphere anchor point when securing the headgear on the infant. The red curves indicate change in oxyhemoglobin concentration (HbO), the blue curves indicate change in de-oxyhemoglobin concentration (HbR), and the green curves indicate the sum total of HbO and HbR (HbT). The black vertical lines indicate time points 0 s and 15 s, the onset and offset of the trial, respectively. The horizontal axis indicates time (−2 s to 25 s), and the vertical axis indicates change in optical density units (ΔOD, in µM cm). The numbers to the right of each waveform indicate the channel (see Figure 4a for reference). The highlighted channels indicate the four spatially contiguous channels (see text) that were averaged to obtain a grand mean for a left region of interest (ROI). The response obtained in the left ROI differed significantly for conditions (a) and (c). In contrast, the left ROI response obtained in conditions (b) and (d), and conditions (a) and (b), did not differ significantly.

