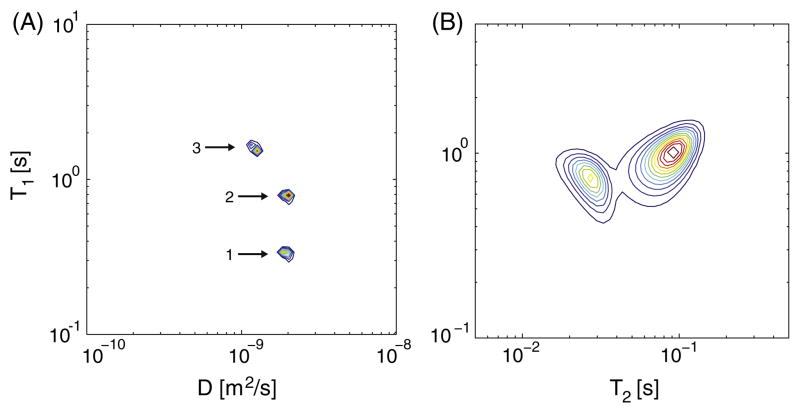
Fig. 2.
(A) Ground truth T1-D distribution obtained from a separate analysis of each (T1,D) sample and averaging according to the relative spin density. The 3 peaks are identified and numbered for future reference, and their (gmT1, gmD) values were 1. (293 ms, 2.26 μm2/ms), 2. (782 ms, 1.99 μm2/ms), and 3. (1596 ms, 1.24 μm2/ms). (B) T1-T2 relaxometry of the simulated ground truth, with peaks centers (T1, T2) at (921 ms, 27.1 ms) and (1013 ms, 73.6 ms).

